

ABSTRACT
V446 Her is the best example of an old nova which has developed dwarf nova (DN) eruptions in the post-nova state. We report on observed properties of the long-term light curve of V446 Her, using photometry over 19 years. Yearly averages of the outburst (OB) magnitudes show a decline of ∼0.013 mag yr−1, consistent with the decline of other post-novae that do not have DN OBs. Previous suggestions of bimodal distributions of the amplitudes and widths of the OBs are confirmed. The OBs occur at a mean spacing of 18 days but the range of spacings is large (13–30 days). From simulations of DN OBs, it has been predicted that the OB spacing in V446 Her will increase as  from the red dwarf companion slowly falls following the nova; however, the large intrinsic scatter in the spacings serves to hide any evidence of this effect. We do find a systematic change in the OB pattern in which the brighter, wider type of OBs disappeared after late 2003, and this phenomenon is suggested to be due to falling
  following the nova.
1. INTRODUCTION
V446 Her was a rather undistinguished nova, reaching V ∼ 6 in 1960. It is at ∼1 kpc distance and has an orbital period of 4.97 hr (Thorstensen & Taylor 2000). Honeycutt et al. (1995; Paper I) reported that V446 Her had regular ∼1.5 mag outbursts (OBs) in monitoring data beginning three decades after the nova eruption. The OB amplitudes were smaller than those of dwarf novae (DNe), leading to the tentative conclusion that the events were due to variations in mass transfer from the red dwarf (RD).
In a later paper, Honeycutt et al. (1998; Paper II) found that V446 Her has two close neighboring stars (likely to be optical companions) whose constant light is usually blended with the light of V446 Her, attenuating the apparent amplitude of the OBs. When this effect is taken into account, the OB amplitude becomes ∼2.5 mag, in line with that expected from a DN. Paper II suggested that bi-modal distributions of OB spacings and OB amplitudes were present in V446 Her, concluding that the OBs were indeed due to V446 Her having become a DN some decades after the novae. Many old novae are declining in brightness by ∼0.01 mag yr−1 50 years after the nova event (Duerbeck 1992). This is consistent with the hibernation scenario of cyclic nova evolution (Shara 1989) in which this decline in  eventually takes the accretion disk (AD) through the DN regime, and finally into hibernation. Prior to the discovery of regular OBs in V446 Her, the observational evidence for old nova becoming DN some decades after the nova had been only modest (Livio 1987; 1990), but the V446 Her DN OBs are a secure example of the phenomenon. As such, these OBs are a potentially sensitive test of AD theory and simulations, in which the effect of slowly lowering
  might be observed.
An additional 11 observing seasons of V446 Her photometry have accumulated since Paper II. This new study was motivated by the possibility that a systematic evolution of the DN OB spacing might be found, as predicted by AD simulations of the dependence of OB spacing on  (e.g., Ichikawa & Osaki 1994). We will also examine other systematics of the V446 Her light curve OBs over nearly two decades, seeking confirmation of the bimodal OB properties which were suggested in Paper II.
2. DATA ACQUISITION AND REDUCTION
Our long-term photometry of V446 Her consists of two sets 1991–2004 and 2007–2009. The first is from an unattended, autonomous 0.41 m telescope in central Indiana, informally called RoboScope (Honeycutt et al. 1994 and references therein). Flats and other detector calibration data were automatically acquired and applied each night, followed by aperture photometry and field identification, all using custom software (Honeycutt & Turner 1992). Final photometric reductions were done using the incomplete ensemble photometry routines contained in Astrovar, which is a custom package based on the technique described in Honeycutt (1992), but with the addition of a graphical user interface. The RoboScope Astrovar solution used 111 ensemble stars, and the zero point was established to within 0.025 mag using five secondary standards from Henden & Honeycutt (1997). The second long-term sequence was acquired during 2007–2009 using an unattended, autonomous 1.25 m telescope at the same site as RoboScope. These data were reduced using a custom batch pipeline consisting of IRAF4 routines for detector calibrations, followed by the application of SExtractor.5 The light curves were then generated using Astrovar, employing a total of 228 ensemble comparison stars. The zero point was determined to within 0.022 mag using nine secondary standards from Henden & Honeycutt (1997). The exposure times were 4 minutes for RoboScope, and 3 minutes for the 1.25 m; all exposures were in the V band. As in Papers I and II, all magnitudes discussed here are for the blended light of V446 Her and the two close non-variable companions.
The number of useable RoboScope images is 1257, plus 127 from the 1.25 m telescope. Figure 1 shows our full light curve. The individual errors (which for clarity are not shown in the light curves) are for differential magnitudes with respect to the ensemble. For the RoboScope data, the average error in quiescence (taken to be V fainter than 16.5) is 0.06 mag, while the average error is 0.03 mag for V brighter than 16.5. For the 1.25 m data, the corresponding errors are 0.04 mag and 0.02 mag.
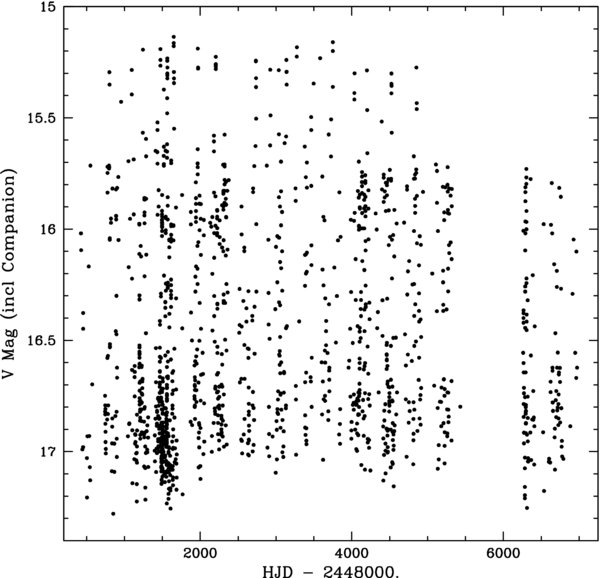
Figure 1. Full light curve of V446 Her from 1991 June 18 to 2009 May 21. The magnitudes are for the blended light of V446 Her and its two close non-variable companion stars.
Download figure:
Standard image High-resolution imageThe magnitude limit of RoboScope is V ∼ 18 on a clear moonless night, but this limit is degraded when moonlight and/or haze is present. We see in Figure 1 that V446 Her does not fall to the magnitude limit of RoboScope on any night, some of which are clear and moonless, always remaining brighter than V ∼ 17.5. However, when the magnitude limit is degraded, V446 Her is often not detected while in quiescence. This means that the RoboScope data in quiescence are more poorly sampled than the brighter portions of the light curve, by nearly double. This effect is much less pronounced for the 1.25 m data.
Figures 2–7 show the light curve of V446 Her by observing season. Some of the seasons are too poorly sampled to allow characterization of the individual OBs, but several seasons easily resolve sequences of OBs.
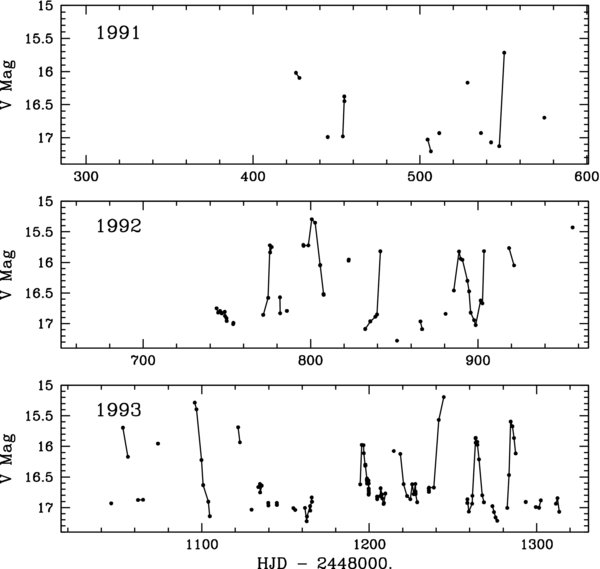
Figure 2. Expanded portions of Figure 1 for three observing seasons 1991–1993, using RoboScope data. Data points separated by less than 3.5 days are connected with straight lines.
Download figure:
Standard image High-resolution image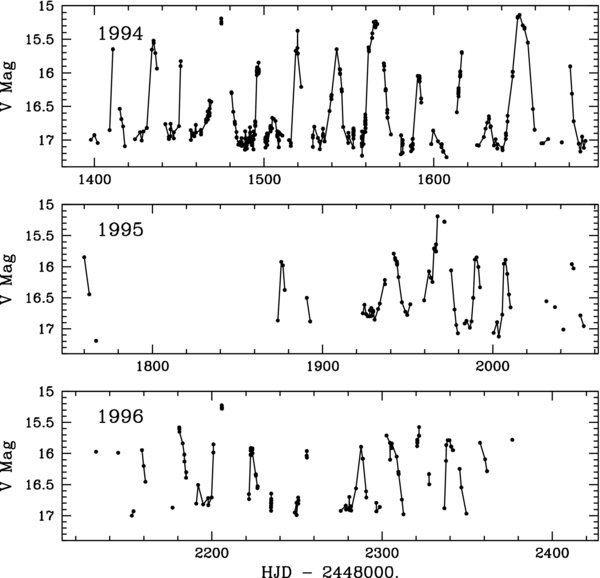
Figure 3. Same as Figure 2, except for observing seasons 1994–1996.
Download figure:
Standard image High-resolution image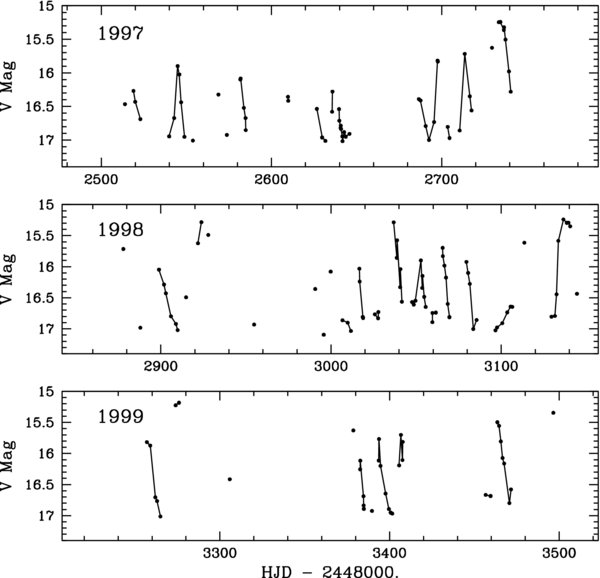
Figure 4. Same as Figure 2, except for observing seasons 1997–1999.
Download figure:
Standard image High-resolution image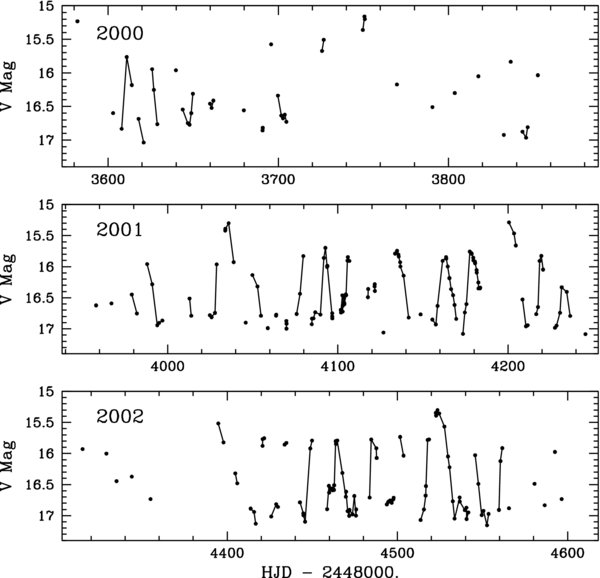
Figure 5. Same as Figure 2, except for observing seasons 2000–2002.
Download figure:
Standard image High-resolution image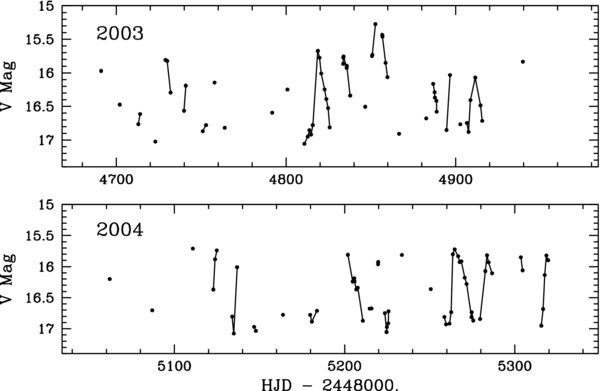
Figure 6. Same as Figure 2, except for observing seasons 2003 and 2004.
Download figure:
Standard image High-resolution image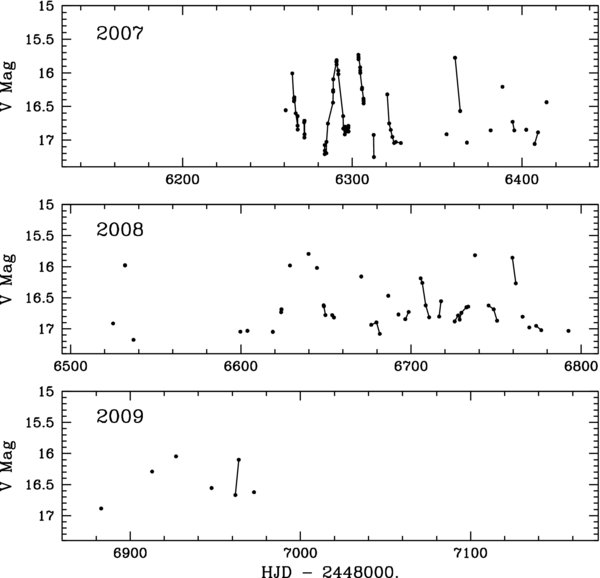
Figure 7. Same as Figure 2, except that these data for years 2007–2009 were obtained using the Indiana University 1.25 m telescope.
Download figure:
Standard image High-resolution imageTable 1 lists the JDs, magnitudes, errors and telescope used. The complete version of Table 1 is available in the online version of the journal; the data will also be archived with the AAVSO.
Table 1. Magnitudes for V446 Her
| JD | V Mag | Error | Source |
|---|---|---|---|
| 2448425.71760 | 16.019 | 0.025 | IU 0.41 m |
| 2448427.79330 | 16.095 | 0.040 | IU 0.41 m |
| 2448444.72012 | 16.990 | 0.043 | IU 0.41 m |
| 2448453.83903 | 16.980 | 0.051 | IU 0.41 m |
| 2448454.65772 | 16.377 | 0.035 | IU 0.41 m |
| 2448454.75431 | 16.448 | 0.032 | IU 0.41 m |
| 2448504.60180 | 17.029 | 0.046 | IU 0.41 m |
| 2448506.56617 | 17.206 | 0.056 | IU 0.41 m |
| 2448511.55818 | 16.931 | 0.046 | IU 0.41 m |
| 2448528.52908 | 16.168 | 0.022 | IU 0.41 m |
| 2448536.54353 | 16.930 | 0.053 | IU 0.41 m |
| 2448542.60561 | 17.070 | 0.066 | IU 0.41 m |
| ⋅⋅⋅ | ⋅⋅⋅ | ⋅⋅⋅ | ⋅⋅⋅ |
| ⋅⋅⋅ | ⋅⋅⋅ | ⋅⋅⋅ | ⋅⋅⋅ |
| ⋅⋅⋅ | ⋅⋅⋅ | ⋅⋅⋅ | ⋅⋅⋅ |
| 2454972.75238 | 16.623 | 0.024 | IU 1.25 m |
Only a portion of this table is shown here to demonstrate its form and content. Machine-readable and Virtual Observatory (VO) versions of the full table are available.
Download table as: Machine-readable (MRT)Virtual Observatory (VOT)Typeset image
3. ANALYSIS AND DISCUSSION
Decades after the nova event, many old novae are becoming fainter on average by ∼0.01 mag yr−1 (Duerbeck 1992). This is probably due to fading irradiation of the RD by the white dwarf (WD) as the WD cools from the nova explosion, thereby decreasing  and the accretion luminosity. The same effects are expected to be present if the cataclysmic variable (CV) has become a DN. However, unlike in a nova-like (NL) CV, the disk in a DN is not in steady state, so it is unclear what kind of photometric measure might be appropriate to test for this fading in V446 Her. In Figure 8, we plot the seasonal averages of the V446 Her data for 3 mag ranges. The quiescence data show no systematic fading, which might be expected because the disk is far from steady state and is not expected to be reflecting
  from the RD. However, as seen in the top panel of Figure 8, the OB magnitudes show a fading of 0.010 ± 0.003 mag yr−1. When corrected for the contributions of the two constant companion stars, whose light is included in the measurements, the decline becomes 0.013 ± 0.003 mag yr−1, still consistent with the Duerbeck value for old novae. Because OB is the state in which most of the accretion luminosity is released, we take this as confirmation of the expected fading. When we use all the data (middle curve in Figure 8) we again see no fading, but these data are dominated by the larger number of points in quiescence.
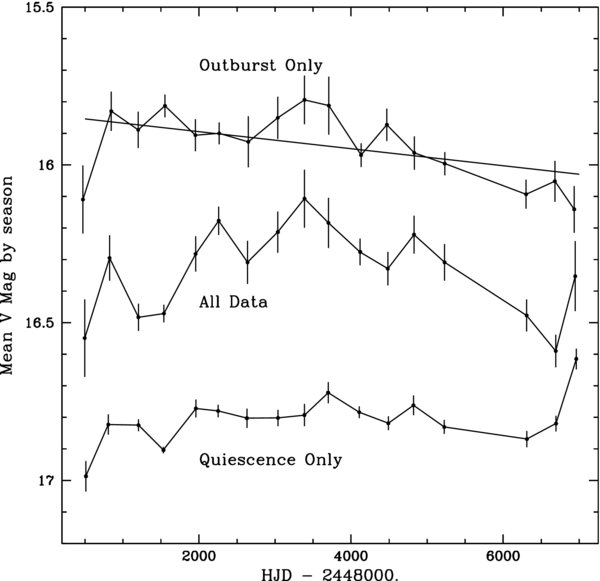
Figure 8. Magnitude corresponding to the average intensity for each observing season of V446 Her, using the data shown in Figure 1. Top is for outburst data only, taken to be points with V < 16.5; middle is for all data; bottom is for quiescence data only, taken to be points with V > 16.5. The error bars are for one standard deviation of the mean. The straight-line fit to the top plot has a slope of 0.01 mag yr−1, consistent with the decline of other old novae in the decades following the nova.
Download figure:
Standard image High-resolution imageNext, we investigated the spacing, widths, and peak brightnesses of the individual OBs in V446 Her. Many of the OBs are missed due to unfavorable data sampling, and even for detected OBs the spacing can be measured only if there are enough quiescence data between adjacent OBs to insure that no intervening OBs were missed. Similarly, the amplitudes and widths can be measured only if the light curve is reasonably well-sampled near the top and sides, respectively, of the OB. The OB parameters that are plotted and discussed are therefore for mostly (but not fully) the same set of OBs.
Ichikawa & Osaki (1994) found from one-dimensional numerical simulations that the OB recurrence interval scales as  for
for  1016.3 g s−1, below which the recurrence interval is constant. Their simulations used system parameters appropriate to U Gem, and two treatments of αcold were employed. In Case A, αcold rises weakly with disk radius, while in Case B, it is held constant. For Case A, the recurrence interval becomes constant at 200 days while for Case B the recurrence interval becomes constant at 18 days. For reference, the average OB recurrence interval in V446 Her is 18 days. If we assume for the moment that V446 Her is always in the t
 regime, then a V-band fading of 1% yr−1 would result in a 2% increase in trecur each year. This would be easily discernable over one to two decades if it were not for the fact that in V446 Her trecur varies erratically over the range 13–30 days.
In Figure 9, we plot the spacing of adjacent OBs for a 14 year interval. Although there are clearly systematic effects in this plot, there is no obvious monotonic behavior. The reason for this may lie in the complicated patterns of OB behaviors, which may reflect a situation in which the effects of falling  on the OBs show up more in the character of the OBs rather than in the spacing.
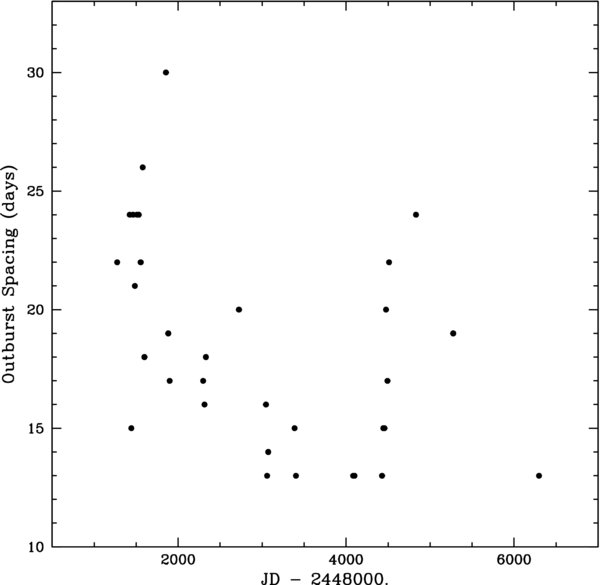
Figure 9. Spacing in days of adjacent outbursts in V446 Her, over ∼14 years.
Download figure:
Standard image High-resolution imageIn Paper II, it was suggested that the OBs in V446 Her were bimodal in both amplitude and width. This new larger data set can be used to confirm and expand upon these results. In Figure 10, the distribution of amplitudes is clearly bimodal, as can also be seen in the light curves of Figures 2–7. Referring to the lower panel of Figure 10 it appears that the OB widths are also bimodal. It is therefore not surprising that Figure 11 shows OB widths correlated with the amplitudes. The data points in Figure 11 seem to fall into two groupings corresponding to the double peaks in Figure 10.
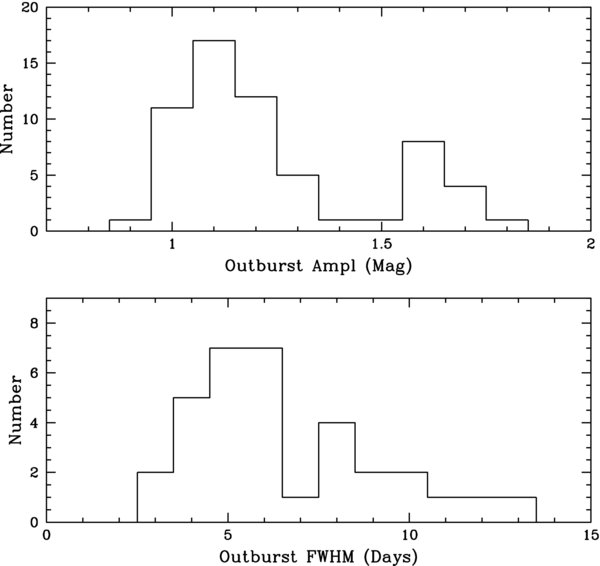
Figure 10. Top: histogram of the outburst amplitudes in V446 Her. These amplitudes are attenuated by the inclusion of the constant light of the optical companions in the measurements (see the text for details). Bottom: histogram of the widths of the outbursts. This width measurement also includes the light of the two close companions.
Download figure:
Standard image High-resolution image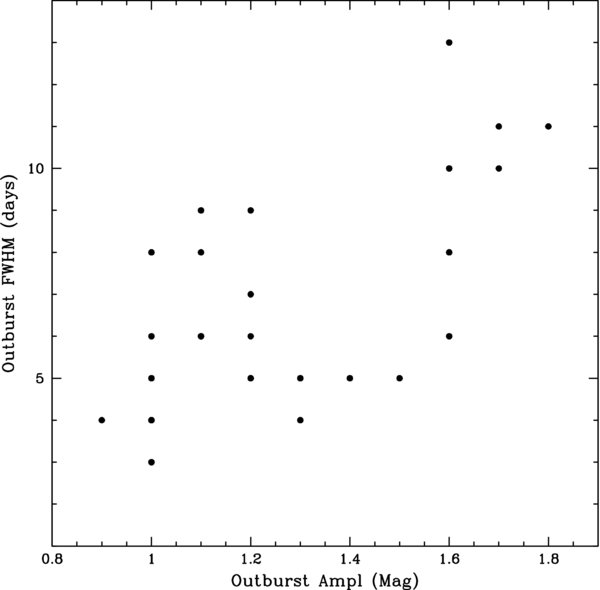
Figure 11. FWHM of the V446 Her outbursts vs. the amplitude of the outbursts.
Download figure:
Standard image High-resolution imageIn Figure 1, we see that data points brighter than 15.7 are missing after JD = 2453000. These missing data belong to the brighter, wider OBs that make up longward tails of the distributions in Figure 10. Might this effect be due to small-number statistics? This can be tested by comparing the fraction of bright points before and after 2453000. We wish to exclude quiescence data in this analysis because the completeness of points fainter than 16.5 changes when the data in Figure 1 switch from the 0.41 m telescope to the 1.25 m near 2453500 (see Section 2). Restricting ourselves to OB data (V <16.5), the ratio of the number of OB points brighter and fainter than 15.7 is 76/503 = 0.15 for JD < 2453000. There are 102 data points after 2453000. If the same distribution of OB magnitudes holds, we expect 0.15(102) = 15 points brighter than 15.7 after 2453000, whereas we find zero. For a Poisson distribution with a mean of 15, the probability of finding zero is only 3 × 10⁻⁷. However, this result is not rigorous and is too optimistic (by an unknown but likely large amount) because choosing a magnitude threshold of 15.7 before testing turns this into a post hoc analysis. The Poisson test nevertheless suggests that the effect is real, and we note that the missing brighter OBs occur in data from both telescopes. Only time will tell if this apparent change in OB pattern is temporary or is part of a monotonic change. We suspect that the missing brighter, wider OBs are the reaction of the AD to falling  , and is the manner in which the AD releases less energy, as opposed to larger OB spacings.
Complex patterns of alternating OB amplitudes and shapes are common in some DNe such as SS Cyg (Cannizzo & Mattei 1992; Cannizzo 1993) and may be triggered by variations in  from the RD (Schreiber et al. 2000b). Such patterns are also common (and are in fact a defining characteristic) in SU UMa-type DNe (O’Donoghue 2000; Hellier 2001). SU UMa superoutbursts (SOBs) are brighter and wider than the normal OBs in SU UMa systems, and are thought to occur when the disk grows to a size sufficient for the outer portions of the AD to orbit in a 3:1 resonance with the RD, leading to increased tidal torques and occasional SOBs (Osaki 1996).
Some authors have considered whether enhanced mass transfer from the RD during OB might account for the varying widths and amplitudes of DN OBs (e.g., Smak 1991; Ichikawa et al. 1993; Smak 1999). Hameury et al. (2000) investigated the combined effects of irradiation on both the AD and the secondary star, finding that the large variety of DN OB durations and spacings may result from the interplay of these effects. Such hybrid models seem to be needed to explain some features of DN OB behavior, even if the tidal instability mechanism remains valid for most SOB features. Wide OBs which resulted from the tidal instability would be expected to continue with falling  following the nova; it would simply take longer for the AD to reach the size needed for resonance. On the other hand, wide OBs which resulted from enhanced
  during OB might cease as the irradiation levels needed for this mechanism slowly falls following the nova.
Schreiber et al. (2000a) considered how the effects of irradiation of the AD by the WD might inhibit DN OBs in post-nova. As the WD in V446 Her continues to cool after the nova, it predicts a decrease in OB frequency and an increase in the amplitude of the OBs. Any systematic change in OB spacing in V446 Her appears to be obscured by shorter-term changes in OB spacing, perhaps related to chaotic changes in the shapes and strengths of the OBs, which might in turn be due to changes in  from the RD. We do not see the predicted increase in the amplitude of the OBs in V446 Her. If anything, the average amplitude decreases with time because the larger amplitude, wider OBs become less common over 19 years., as seen by the absence of large amplitude OBs during the last quarter of the data in Figure 1.
4. CONCLUSIONS
The distributions of OB amplitudes and widths in V446 Her are found to be bimodal. This is suggestive of either SS Cyg-type behavior (thought to arise from the action of the thermal/viscous disk instability, perhaps aided by irradiation effects) or from SU UMa-type OB/SOBs (thought to be due to combination of the disk thermal limit cycle, plus a tidal instability in the disk). If a predicted systematic increase in the spacing of the OBs is present, it is hidden by large intrinsic scatter in the recurrence intervals.
A systematic decline in mean brightness, as found in other post-nova systems that do not have DN OBs, appears in V446 Her at 0.013 mag yr−1, consistent with the observed decline in other old novae. This decline shows up only in the OB measures, probably because the accretion luminosity reflecting declining  appears mostly during OB.
The brighter, wider-type OBs of V446 Her disappear abruptly after JD 2453000. If this turns out to be a long-term systematic change in the OB pattern, then it appears to be consistent with enhanced  from the RD during DN OB as the mechanism responsible for the bimodal distribution of the OB widths.
It is somewhat disappointing that the firm prediction of increasing recurrence interval for the V446 Her OBs cannot yet be measured in V446 Her, even after ∼2 decades of photometric monitoring. However, it is quite interesting that the very phenomena helping to obscure this effect shows that, less than three decades after the nova, the V446 Her DN OBs already have many of the kinds of poorly understood patterns of varying OB widths, spacings, and amplitudes seen in some other well-observed DN. These OB patterns therefore appear to be rather immune to any lingering effects of the nova.
Footnotes
- 4
IRAF is distributed by the National Optical Astronomy Observatory, which is operated by the Association of Universities for Research in Astronomy, Inc., under cooperative agreement with the National Science Foundation.
- 5
SEextractor is a source detection and photometry package described by Bertin & Arnouts (1996). It is available from http://terapix.iap.fr/soft/sextractor/.