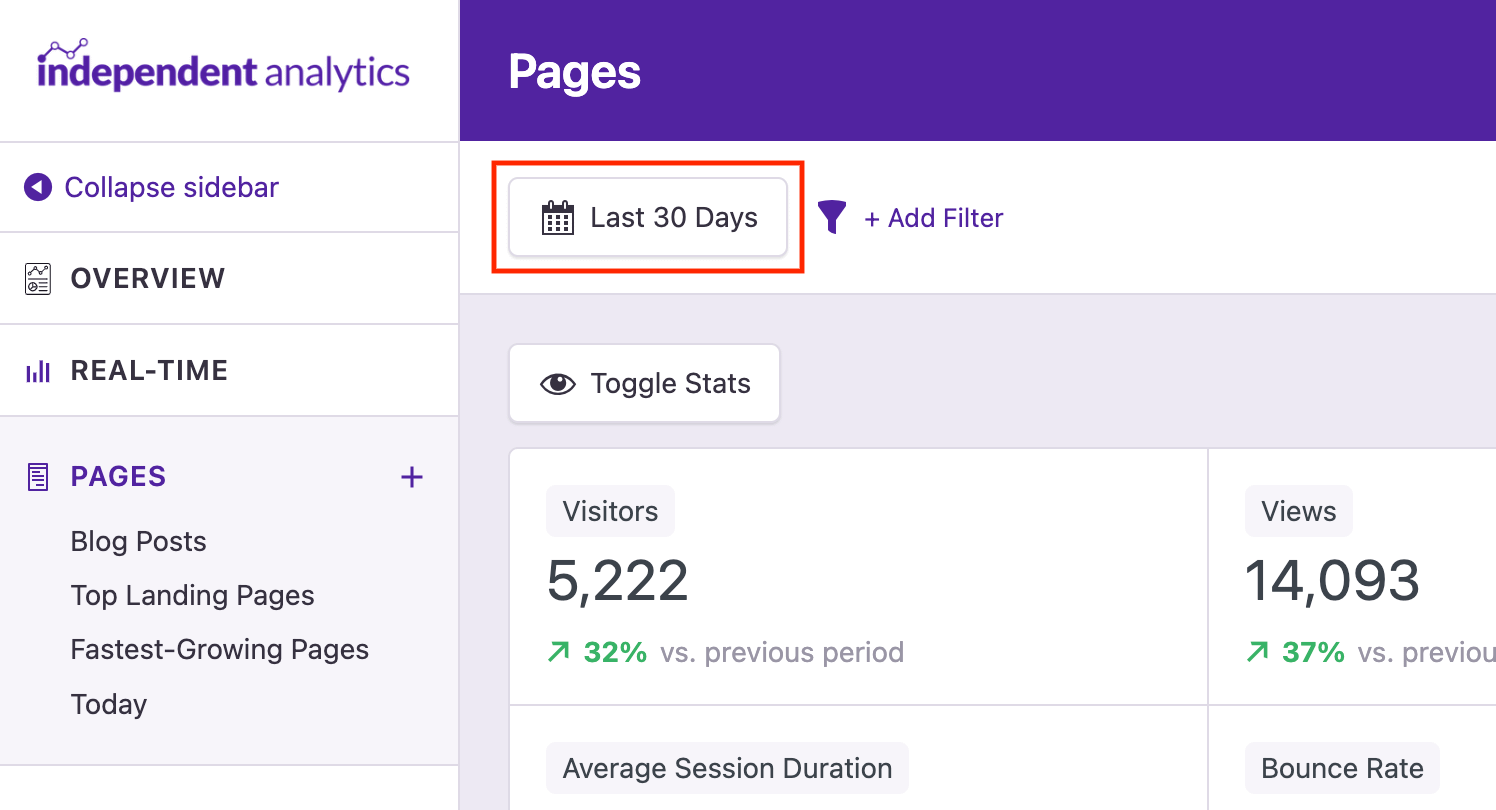
When you visit the analytics dashboard, it will show you data from the past 30 days by default. However, this is easy to change to any date range you want.
To change the date range, start by clicking the date picker button in the toolbar.
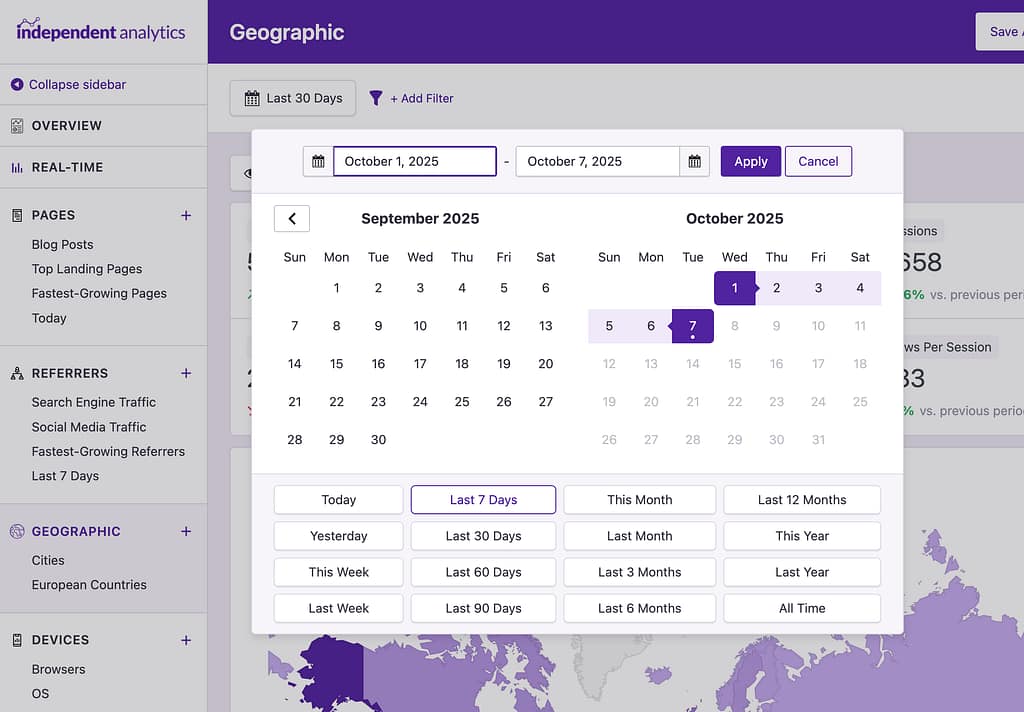
This will open up a calendar where you can select any two days to choose a date range. Additionally, there are buttons for pre-defined ranges, such as Today, Last 7 Days, and This Month. Clicking any of these buttons will automatically select the appropriate dates in the calendar.
Once you’ve selected the dates you want, click the Apply button and the dashboard will reload with the new data. The Quick Stats, chart, and data table will all update to use data from this new range.
The All Time button will select a date range between the first day a view was recorded and today.
Can I Use Both Independent Analytics & Google Analytics?
Yes, that’s not a problem.
If your site is running Google Analytics, you can add the Independent Analytics plugin without causing any kind of conflict or issue.
In fact, it may be a good idea to run them both for a while so you can compare the data collection and ease of use.
Independent Analytics has virtually zero impact on performance, so it won’t make your site any slower while running it in addition to Google Analytics.
Unlike most analytics programs, Independent Analytics will not slow down your site. Here’s why.
Why it’s so fast
There are two reasons why other analytics programs slow down your site:
They are loaded externally
They have a large tracking script
For example, if you use Google Analytics, then your site needs to load the tracking script from their servers. Requests to external sources always take longer than requests for files on your site.
Secondly, the time it takes to load a script depends partially on its size. The Google Analytics script is about 35kb, and if you have other features like outbound click tracking enabled, there will be additional scripts to load as well.
Since Independent Analytics runs entirely on your site, there is no external request. Additionally, the tracking script is only 12kb, and it’s inlined to the page, so there is no file request at all.
The tracking script uses the WordPress REST API to asynchronously record page views in your database without affecting your site’s load time.
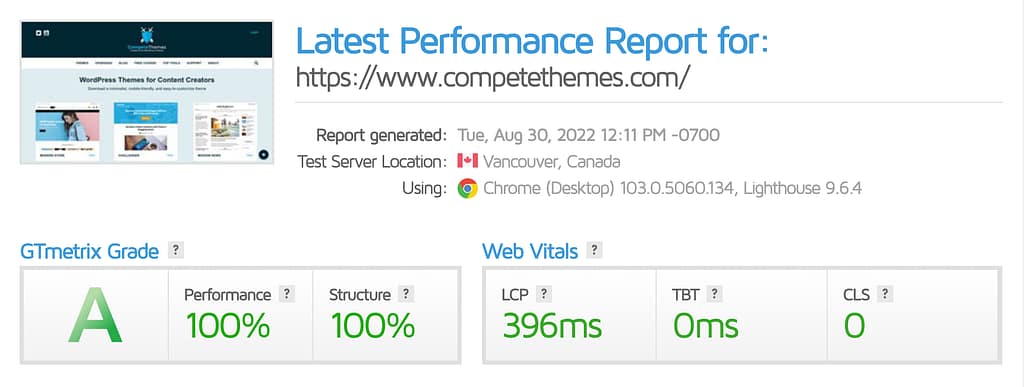
If you measure your performance before and after installing Independent Analytics, you should see no difference, like on the Compete Themes website, which scored 100% on GTMetrix both before and after adding the Independent Analytics plugin.
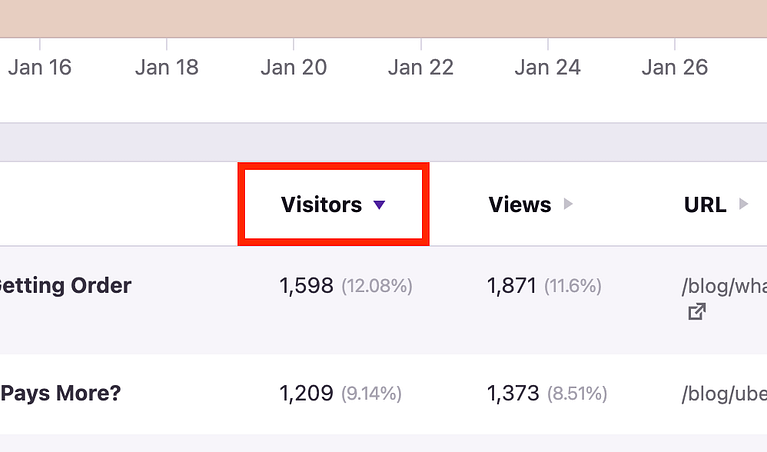
Each report sorts the table rows by the most-to-least visitors. You can click on any column heading to re-sort the table by that property.
Clicking Visitors will toggle the order from most to least visitors
On the first click, your data will be sorted by ascending values. For instance, the Title column will sort alphabetically (A-Z). The second click will sort the data by descending values (Z-A). Subsequent clicks will toggle between ascending and descending sorts.
If you find yourself needing additional flexibility when sorting, this might be a sign that you should try filtering your data.
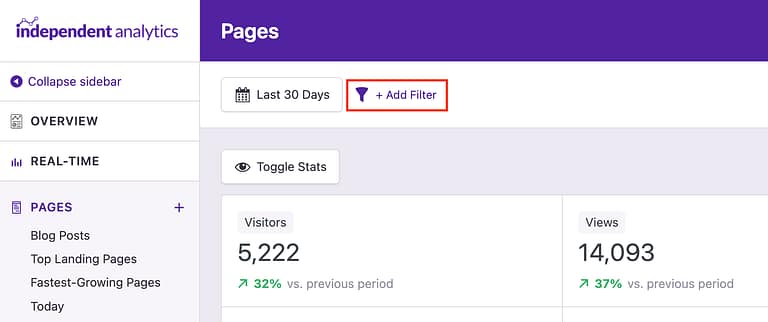
The filtering system is an invaluable tool for digging deeper into your data.
To filter your data, start by clicking the Add Filter button.
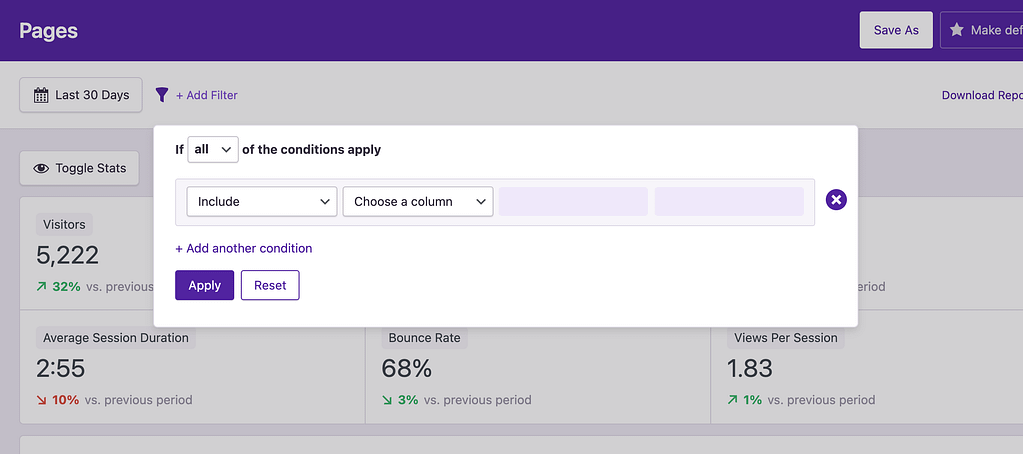
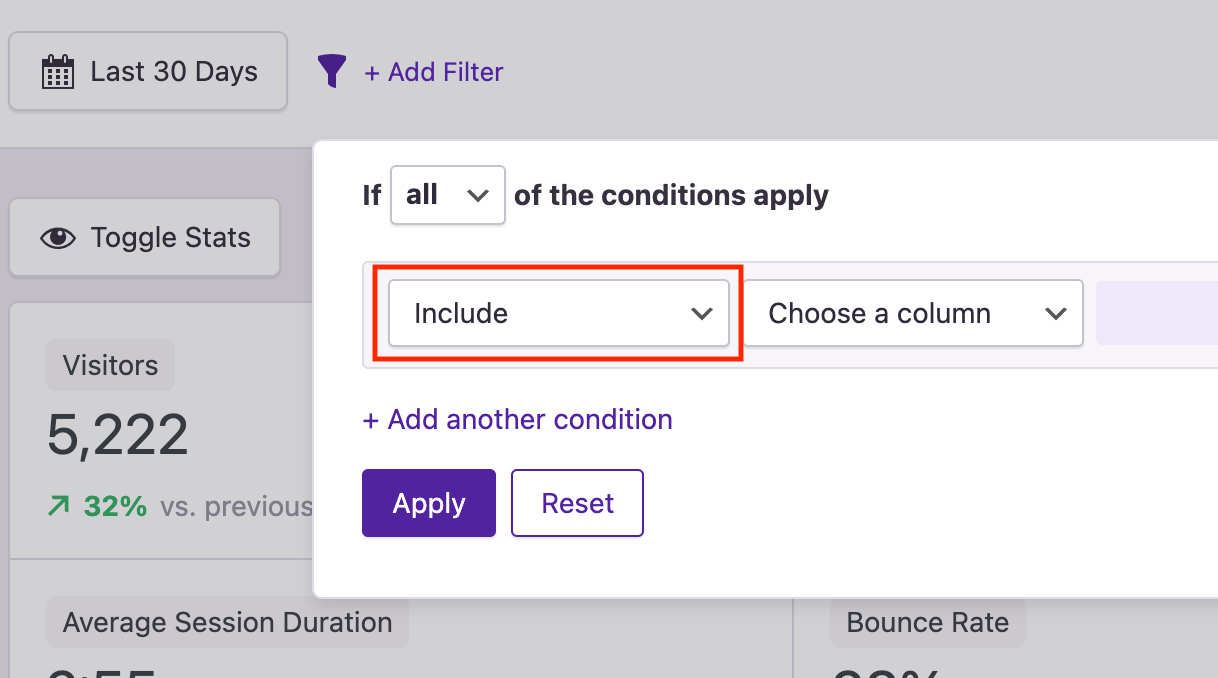
This will open a modal that looks like this:
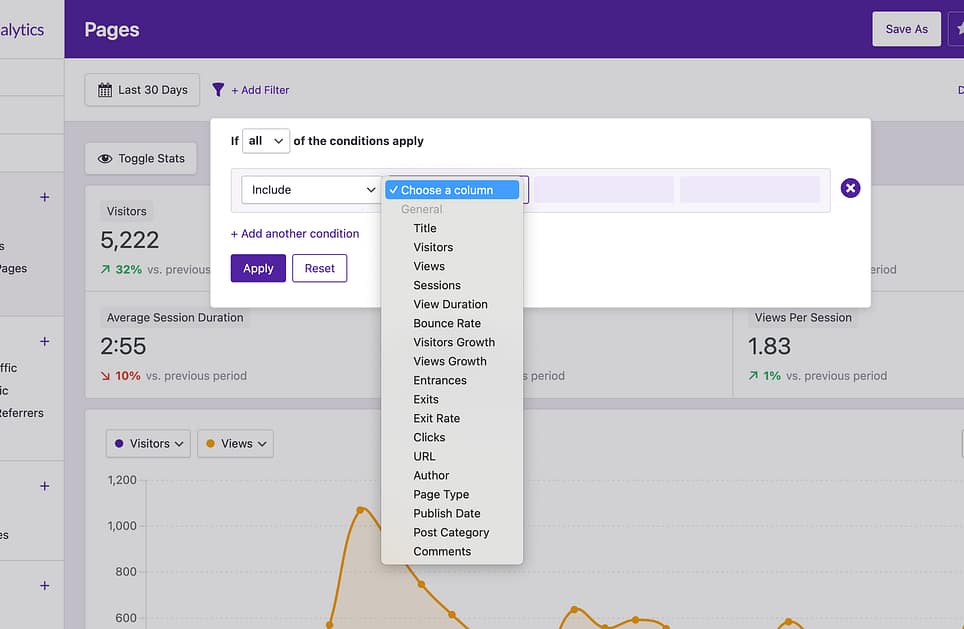
In the modal, you’ll see an option to Choose a column. These columns correspond to the same ones available in the data table below. To continue, select the column you want to filter the report by.
The filter includes all of the columns you see in the data table below.
Once you’ve selected a column, you can choose an operator and an operand.
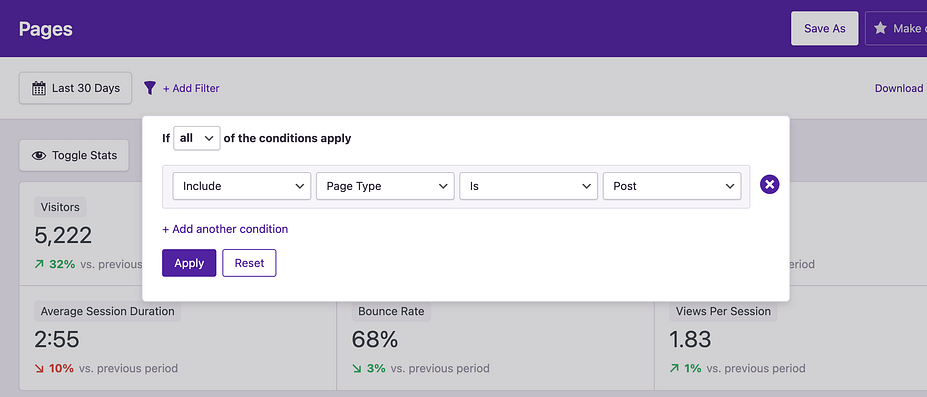
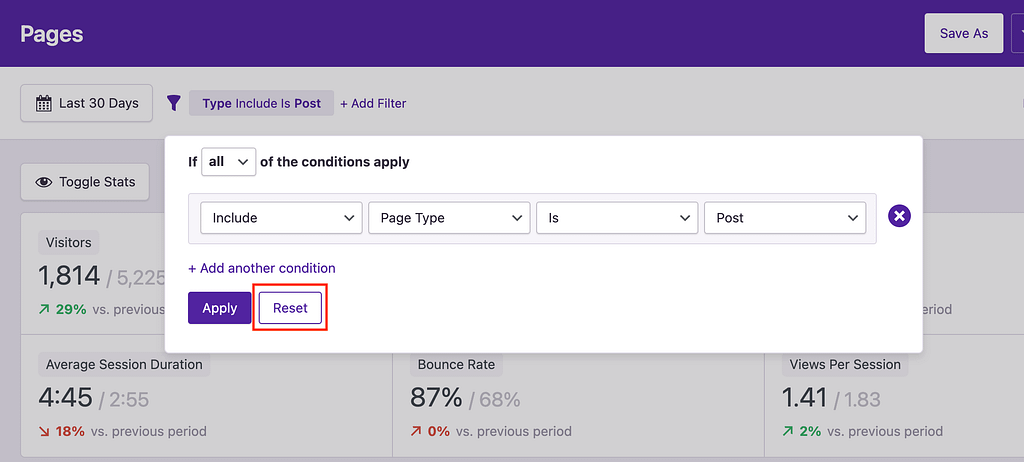
For example, let’s say you want to filter the Pages report so that it only shows stats for your blog posts. You would choose the Page Type column, then select the Is operator and the Post operand.
On the left side of the form, there is also an option to include or exclude pages that match your criteria. By default, it’s set to Include, but you could flip it to Exclude if you wanted to see the stats for all pages that aren’t blog posts.
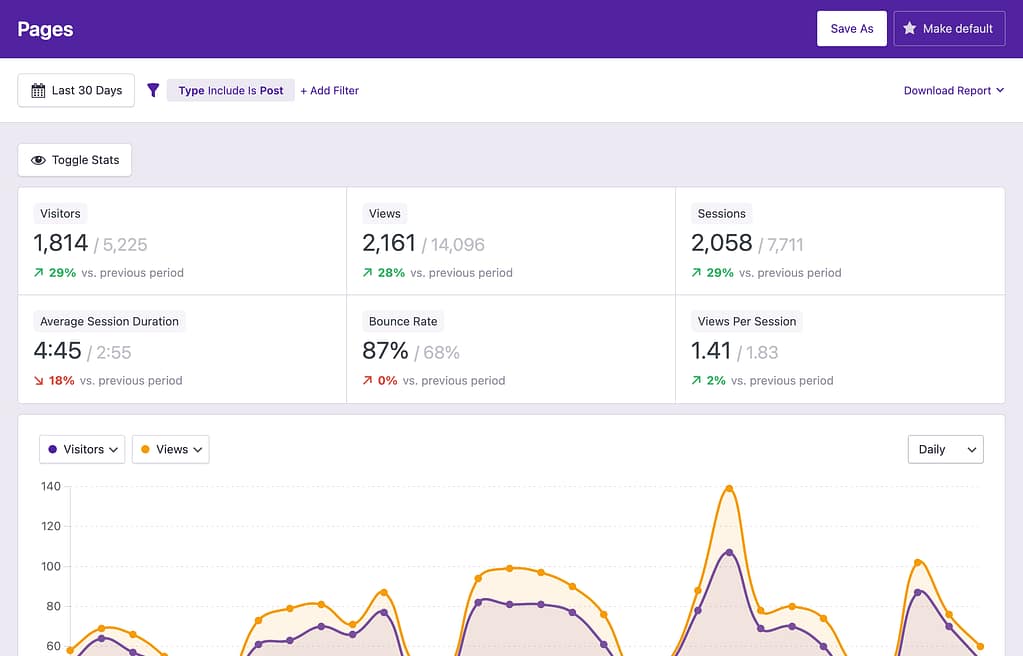
Once you’re happy with your changes, you can click the Apply button. The Quick Stats, chart, and data table will update to reflect the new filters.
In the toolbar, you’ll see a label for the filter you have applied. You’ll also notice that the stats each show two values. The first is the filtered value, and the second is the unfiltered value. For example, you can see that the blog posts on the site have had 1,814 visitors, whereas the site as a whole has had 5,225 visitors.
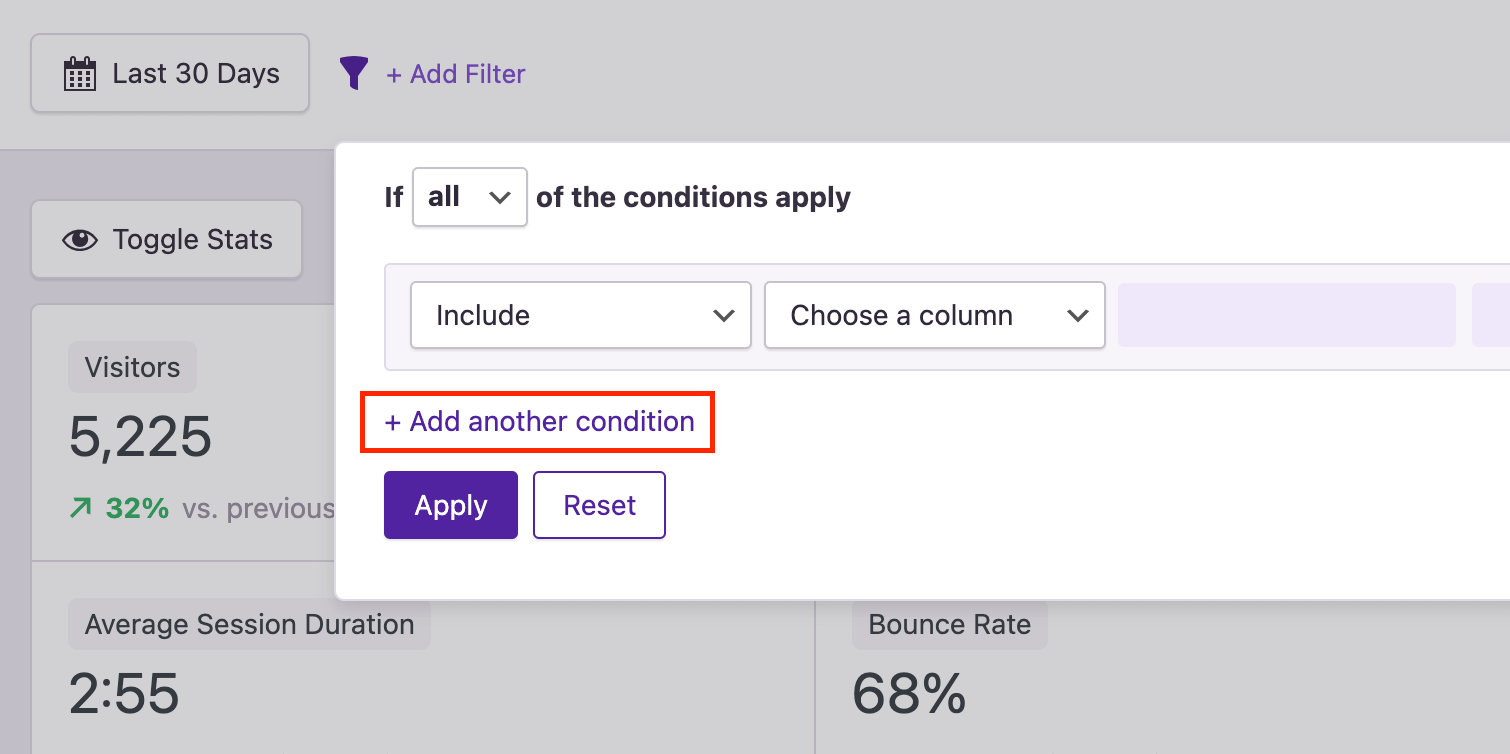
Using multiple conditions
The previous example included one condition that required all rows to belong to Posts. You can add more conditions to your filter by clicking the Add another condition button.
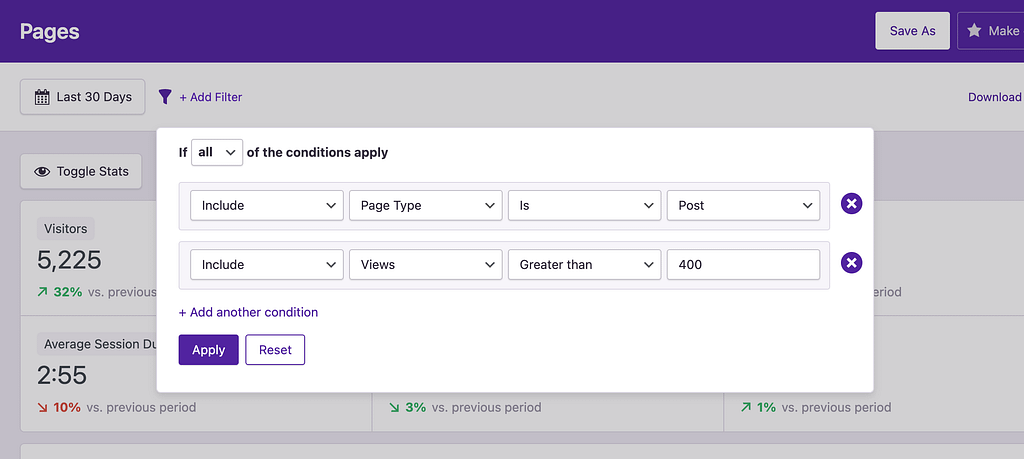
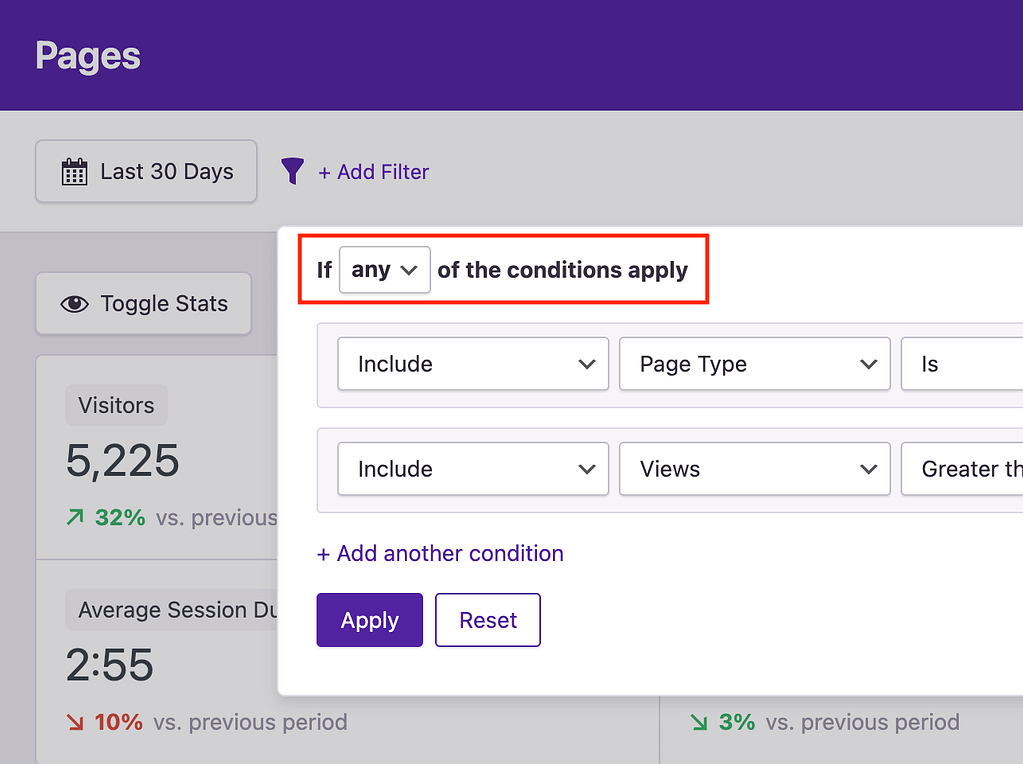
By default, all of the conditions will be required. For example, if you add a filter saying that the page type is “post” and the number of views has to be greater than 400, then only posts with more than 400 views will be included.
However, if you want to include pages that meet either of these conditions, you can switch the option at the top of the modal to any.
Now, a page only has to match one of these conditions to be included. This can be useful in many ways, such as creating a report for a handful of pages matched by their title or URL.
Using the filters, you can create entirely custom reports that help you better understand your website and its visitors. If you create a report that you find especially useful, remember to save it so you can revisit it easily in the future.
And remember, the filters are available in every report, so you can use them to look at specific referrers, locations, and devices too.
Resetting the filter
If you want to undo the changes added by a filter, you can open it and click the Reset button at the bottom.
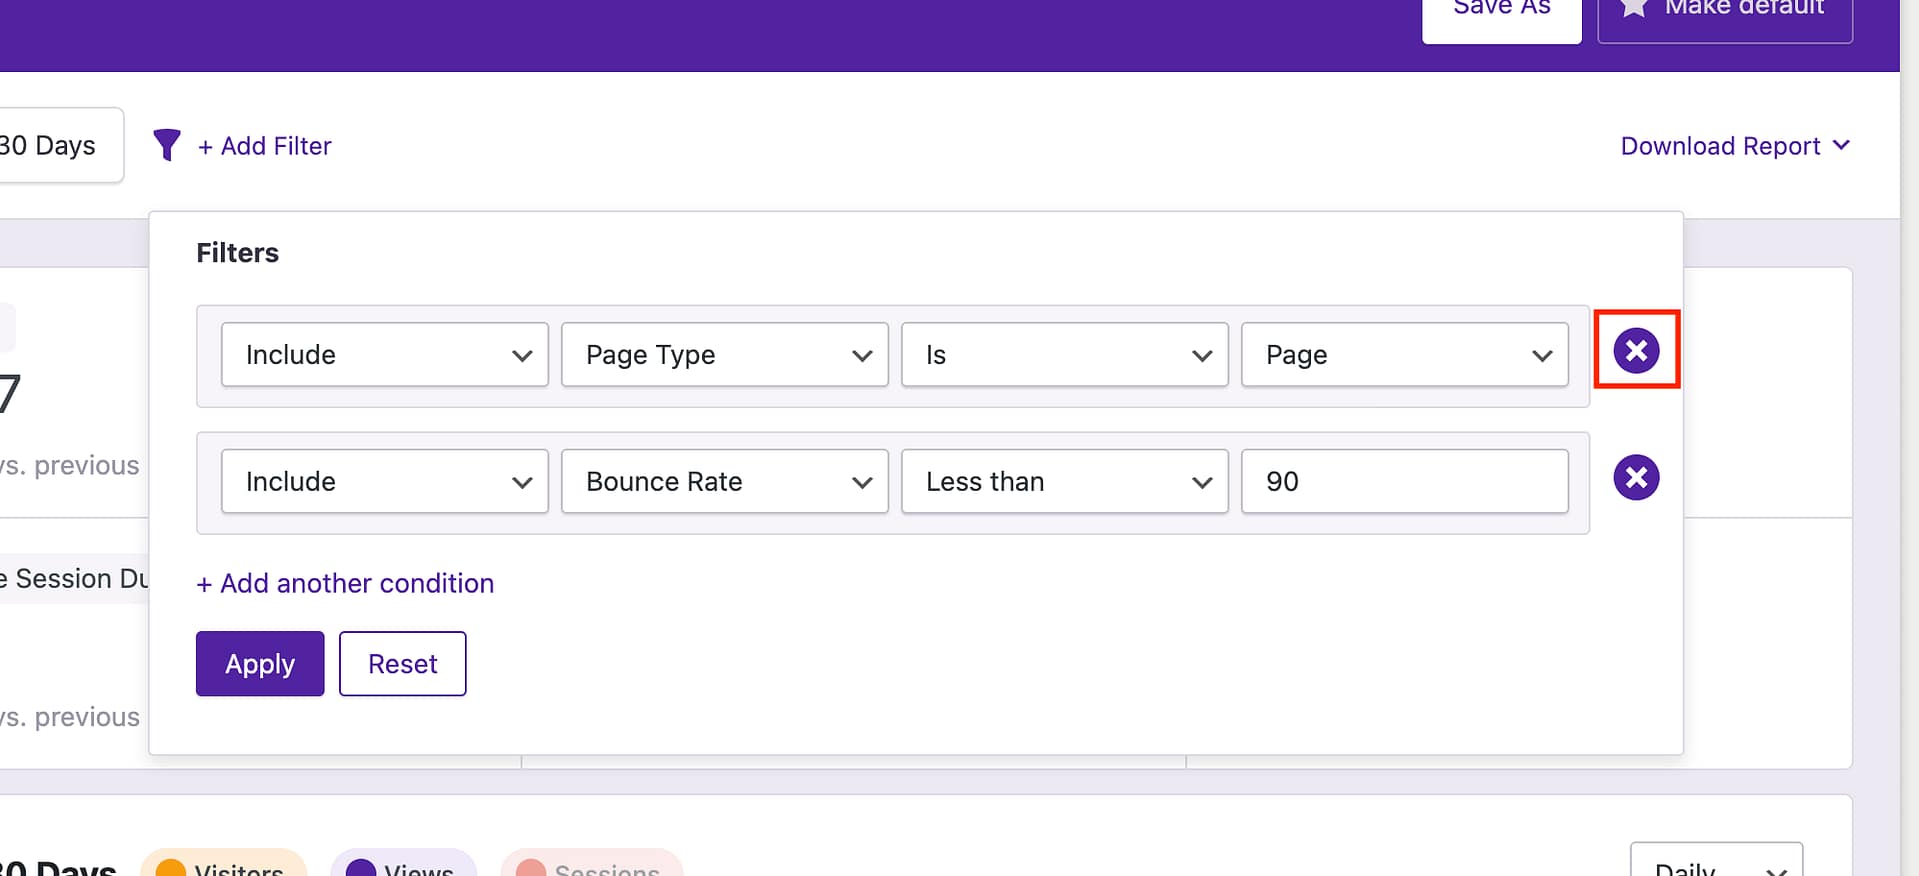
If you’ve added multiple conditions and only want to remove one, you can click the delete button found to the right of the condition.
If the condition has already been applied, the dashboard will refresh automatically to match your new filter settings.
For example, if someone clicks a link in a Tweet that takes them to your site, then the referrer is Twitter.com. If they click on your site in a Google search results page, then the referrer is Google.com.
Referrer types
There are six referrer types included in the dashboard:
Search
Social
AI
Ad
Referral
Direct
Search: search engines like Google, Bing, and DuckDuckGo.
Social: popular social media sites like Twitter, Facebook, and Instagram.
AI: AI tools like ChatGPT, Gemini, and Perplexity.
Ad: advertising platforms, such as Google Ads and Google Display Network
Referral: websites that don’t fit into the social, search, or referral categories. This includes mostly blogs and news sites.
Direct: used when there is no referrer data. This occurs when a visitor types your site’s address into their browser rather than visiting from another site. It can also occur when a privacy feature in the browser strips out the referrer data.
Can I see the page they came from?
Unfortunately, no.
Browsers used to include the page the visitor was referred from, but now they only include the domain. This means that if a visitor arrives on your site from an article on Wikipedia, you can see that they came from Wikipedia, but not the exact page they came from.
The exception is if you have the ability to create the referring link yourself. In this case, you can create a campaign link to track the exact page visitors come from.
For instance, if someone visits one of your blog posts, that is counted as a view. If they click on your homepage, that’s another view. And if they click back to the blog post, that’s another view.
Independent Analytics does not record views for logged-in users, so your activity on the site will not be recorded as long as you’re logged in. You can follow these steps to enable tracking of logged-in users.