The examples in this directory all make use of the Bokeh server, to create data visualization web apps from simple python scripts.
To run any of these examples, excute bokeh serve --show and the name of the script or dirctory that contains the
demo. For example,
bokeh serve --show sliders.py
will run the "sliders" demo, and open it up in a new browser tab.
The demos container here are:
| clustering | |
 |
Demonstrates different scikit-learn clustering alorithms on a few different data sets. |
| fourier_animated | |
 |
A continuously updating demonstration of Fourier synthesis using periodic callbacks |
| movies | |
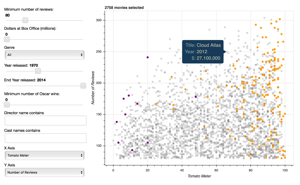 |
An interactive query tool for a set of IMDB data |
| ohlc | |
 |
A simulated streaming OHLC chart with MACD indicator and selectable moving averages using periodic callbacks |
| random_tiles | |
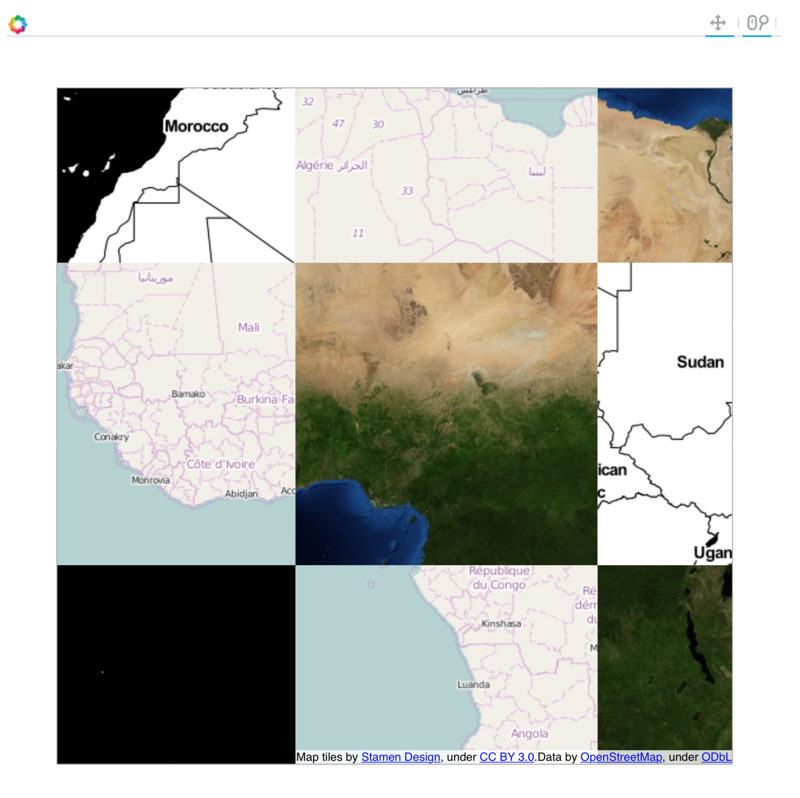 |
Demonstrates a using User Defined Models with Bokeh server |
| selection_histogram | |
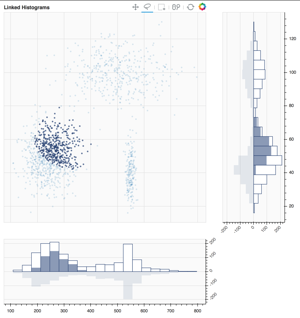 |
Shows axis histograms for selected and nonselected points in a scatter plot |
| sliders | |
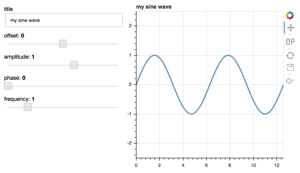 |
A basic demo that has sliders for controlling a plotted trigonometric function |
| timeout | |
 |
An updating plot that demonstrates using timeout callbacks in Bokeh server apps |