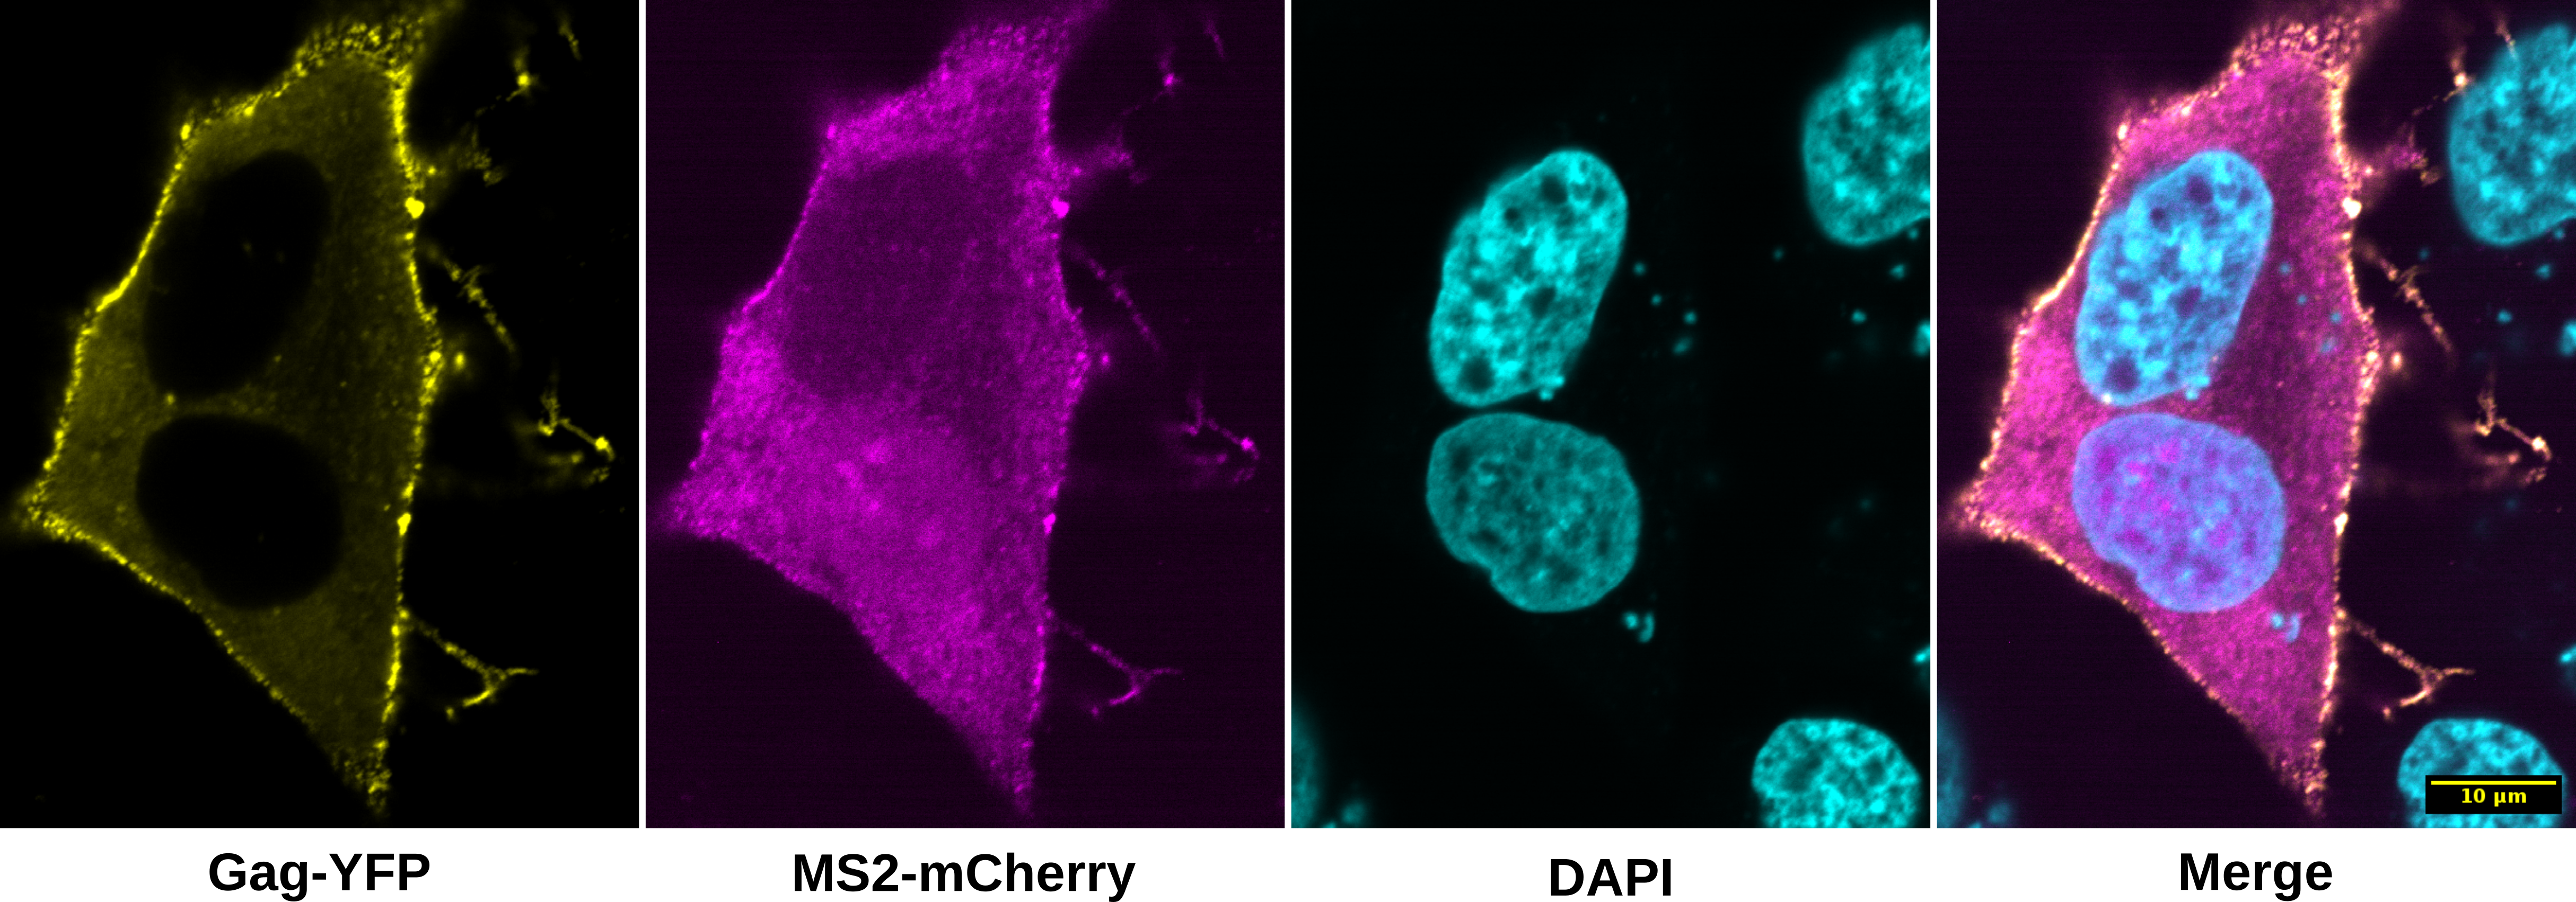
In this example we will use SciJava Ops and the Spatially Adaptive Colocalization Analysis (SACA) 1 framework on HeLa cells transfected with a dual fluorescent HIV-1 NL4-3 construct to colocalize viral mRNAs with HIV-1 NL4-3 Gag proteins. Two fluorescent fusion proteins are made when cells express the modified HIV-1 construct: Gag-mVenus and MS2-mCherry. The Gag-mVenus fusion protein tracks Gag protein, the primary structural component of the HIV-1 virion. The MS2-mCherry fusion protein binds to 24 copies of the MS2 bacteriophage RNA stem-loop 2 inserted into the HIV-1 construct, enabling fixed and live-cell imaging of viral mRNA dynamics. Taken together, this system tracks both Gag and viral mRNAs from the cell's cytoplasm to sites of viral particle assembly at the plasma membrane where they colocalize 3. This example uses fixed cell data collected with a laser-scanning confocal microscope at 60x magnification (oil immersion).
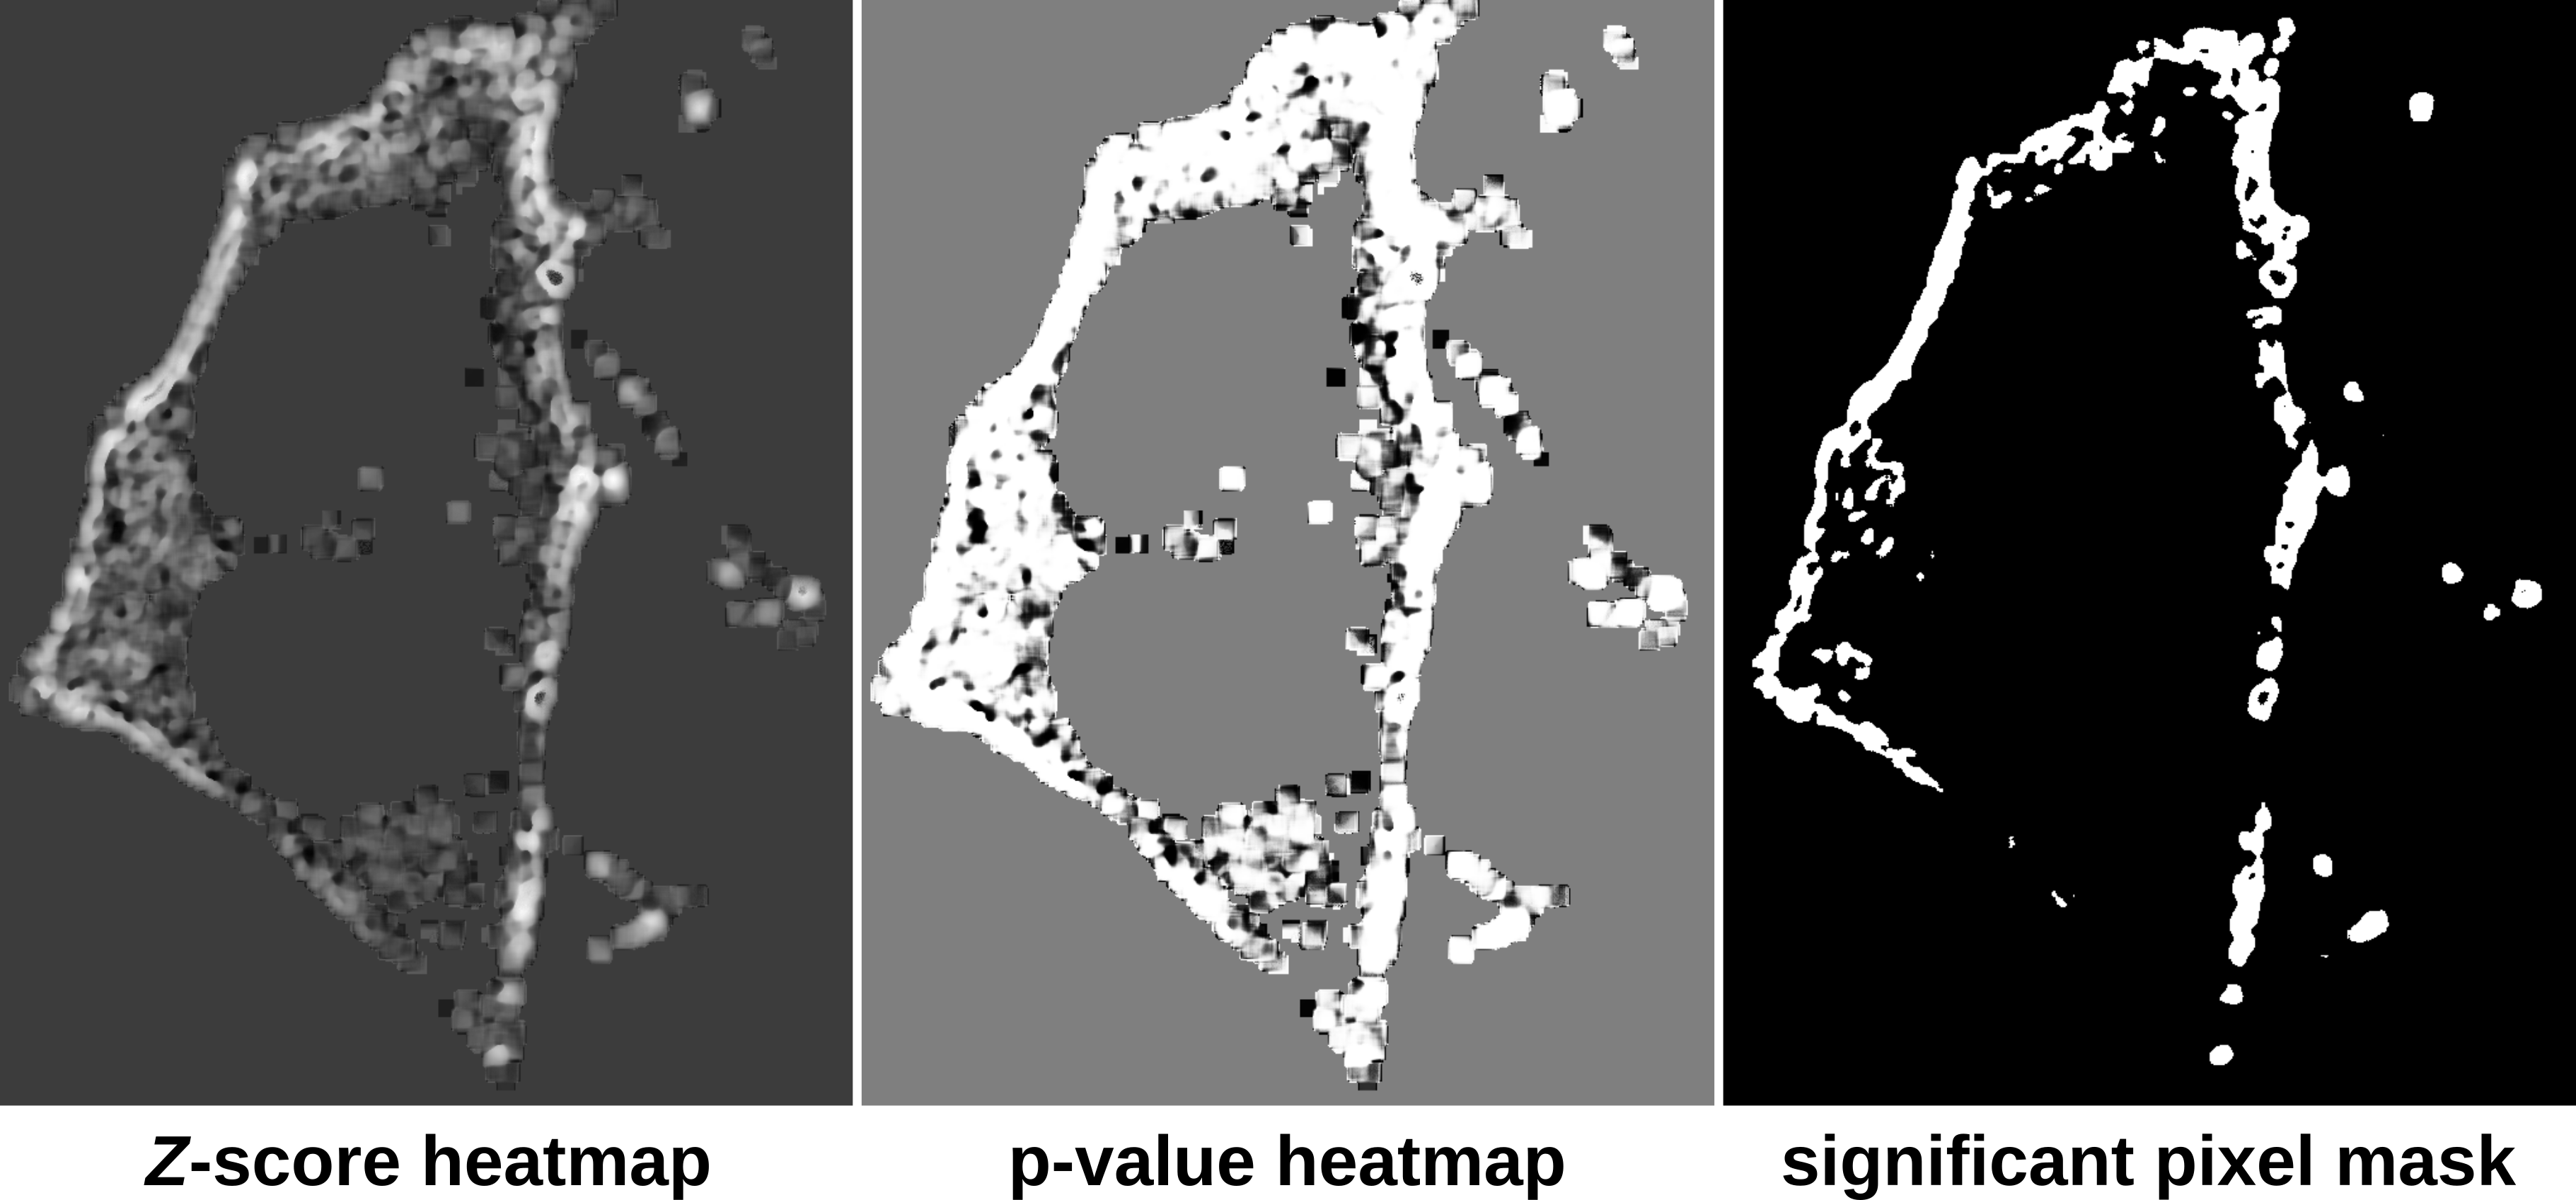
The SACA framework produces three outputs: a Z-score heatmap, a p-valye heatmap and a significant pixel value mask. The Z-score heatmap indicates the relatively colocalization or anti-colocalization strength at a pixel-wise level. The p-value heatmap indicates the p-value of the colocalization strength at a pixel-wise level. Finally the significant pixel mask identifies which pixels are significantly colocalized. This example script takes advantage of this feature of the SACA framework and utilizes the significant pixel mask as a region of interest to compute Pearson's 4 and Li's 5 colocalization quotients.
You can download the colocalization dataset here.
SciJava Ops via Fiji's scripting engine with script parameters:
.. tabs::

   .. code-tab:: scijava-groovy

        #@ OpEnvironment ops
        #@ ConvertService cs
        #@ Img input
        #@output zscore
        #@output pvalue
        #@output sig_mask

        import net.imglib2.type.logic.BitType
        import net.imglib2.roi.labeling.ImgLabeling
        import net.imglib2.roi.labeling.LabelRegions
        import net.imglib2.roi.Regions

        // split input image into channels
        channels = []
        input.dimensionsAsLongArray()[2].times { i ->
                channels.add(ops.op("transform.hyperSliceView").input(input, 2, i).apply())
        }

        // create SACA Z-score heatmap
        zscore = ops.op("coloc.saca.heatmapZScore").input(channels[0], channels[1]).apply()

        // compute pixel-wise p-value
        pvalue = ops.op("stats.pnorm").input(zscore).apply()

        // create SACA significant pixel mask
        sig_mask = ops.op("create.img").input(channels[0], new BitType()).apply()
        ops.op("coloc.saca.sigMask").input(zscore).output(sig_mask).compute()

        // convert SACA sig mask into labeling and run
        // Pearson's and Li's colocalization quotients
        labeling = cs.convert(sig_mask, ImgLabeling)
        regs = new LabelRegions(labeling)
        coloc_region = regs.getLabelRegion(1)
        subsample_1 = Regions.sample(coloc_region, channels[0])
        subsample_2 = Regions.sample(coloc_region, channels[1])
        pearsons = ops.op("coloc.pearsons").input(subsample_1, subsample_2).apply()
        li = ops.op("coloc.icq").input(subsample_1, subsample_2).apply()

        // print Pearson's and Li's results
        print("Pearson's: " + pearsons + "\nLi's: " + li)

   .. code-tab:: python

        #@ OpEnvironment ops
        #@ ConvertService cs
        #@ Img input
        #@output zscore
        #@output pvalue
        #@output sig_mask

        from net.imglib2.type.logic import BitType
        from net.imglib2.roi.labeling import ImgLabeling, LabelRegions
        from net.imglib2.roi import Regions

        # split input image into channels
        channels = []
        for i in range(input.dimensionsAsLongArray()[2]):
            channels.append(ops.op("transform.hyperSliceView").input(input, 2, i).apply())

        # create SACA Z-score heatmap
        zscore = ops.op("coloc.saca.heatmapZScore").input(channels[0], channels[1]).apply()

        # compute pixel-wise p-value
        pvalue = ops.op("stats.pnorm").input(zscore).apply()

        # create SACA significant pixel mask
        sig_mask = ops.op("create.img").input(channels[0], BitType()).apply()
        ops.op("coloc.saca.sigMask").input(zscore).output(sig_mask).compute()

        # convert SACA sig mask into labeling and run
        # Pearson's and Li's colocalization quotients
        labeling = cs.convert(sig_mask, ImgLabeling)
        regs = LabelRegions(labeling)
        coloc_region = regs.getLabelRegion(1)
        subsample_1 = Regions.sample(coloc_region, channels[0])
        subsample_2 = Regions.sample(coloc_region, channels[1])
        pearsons = ops.op("coloc.pearsons").input(subsample_1, subsample_2).apply()
        li = ops.op("coloc.icq").input(subsample_1, subsample_2).apply()

        # print Pearson's and Li's results
        print("Pearson's: " + str(pearsons))
        print("Li's: " + str(li))
Once the script completes, three gray scale images will be displayed: zscore, pvalue and sig_mask.
Additionally the console will print the Pearson's and Li's colocalization coefficients using the significant pixel
mask created from SACA.
Pearson's: 0.65593660643
Li's: 0.211457241276
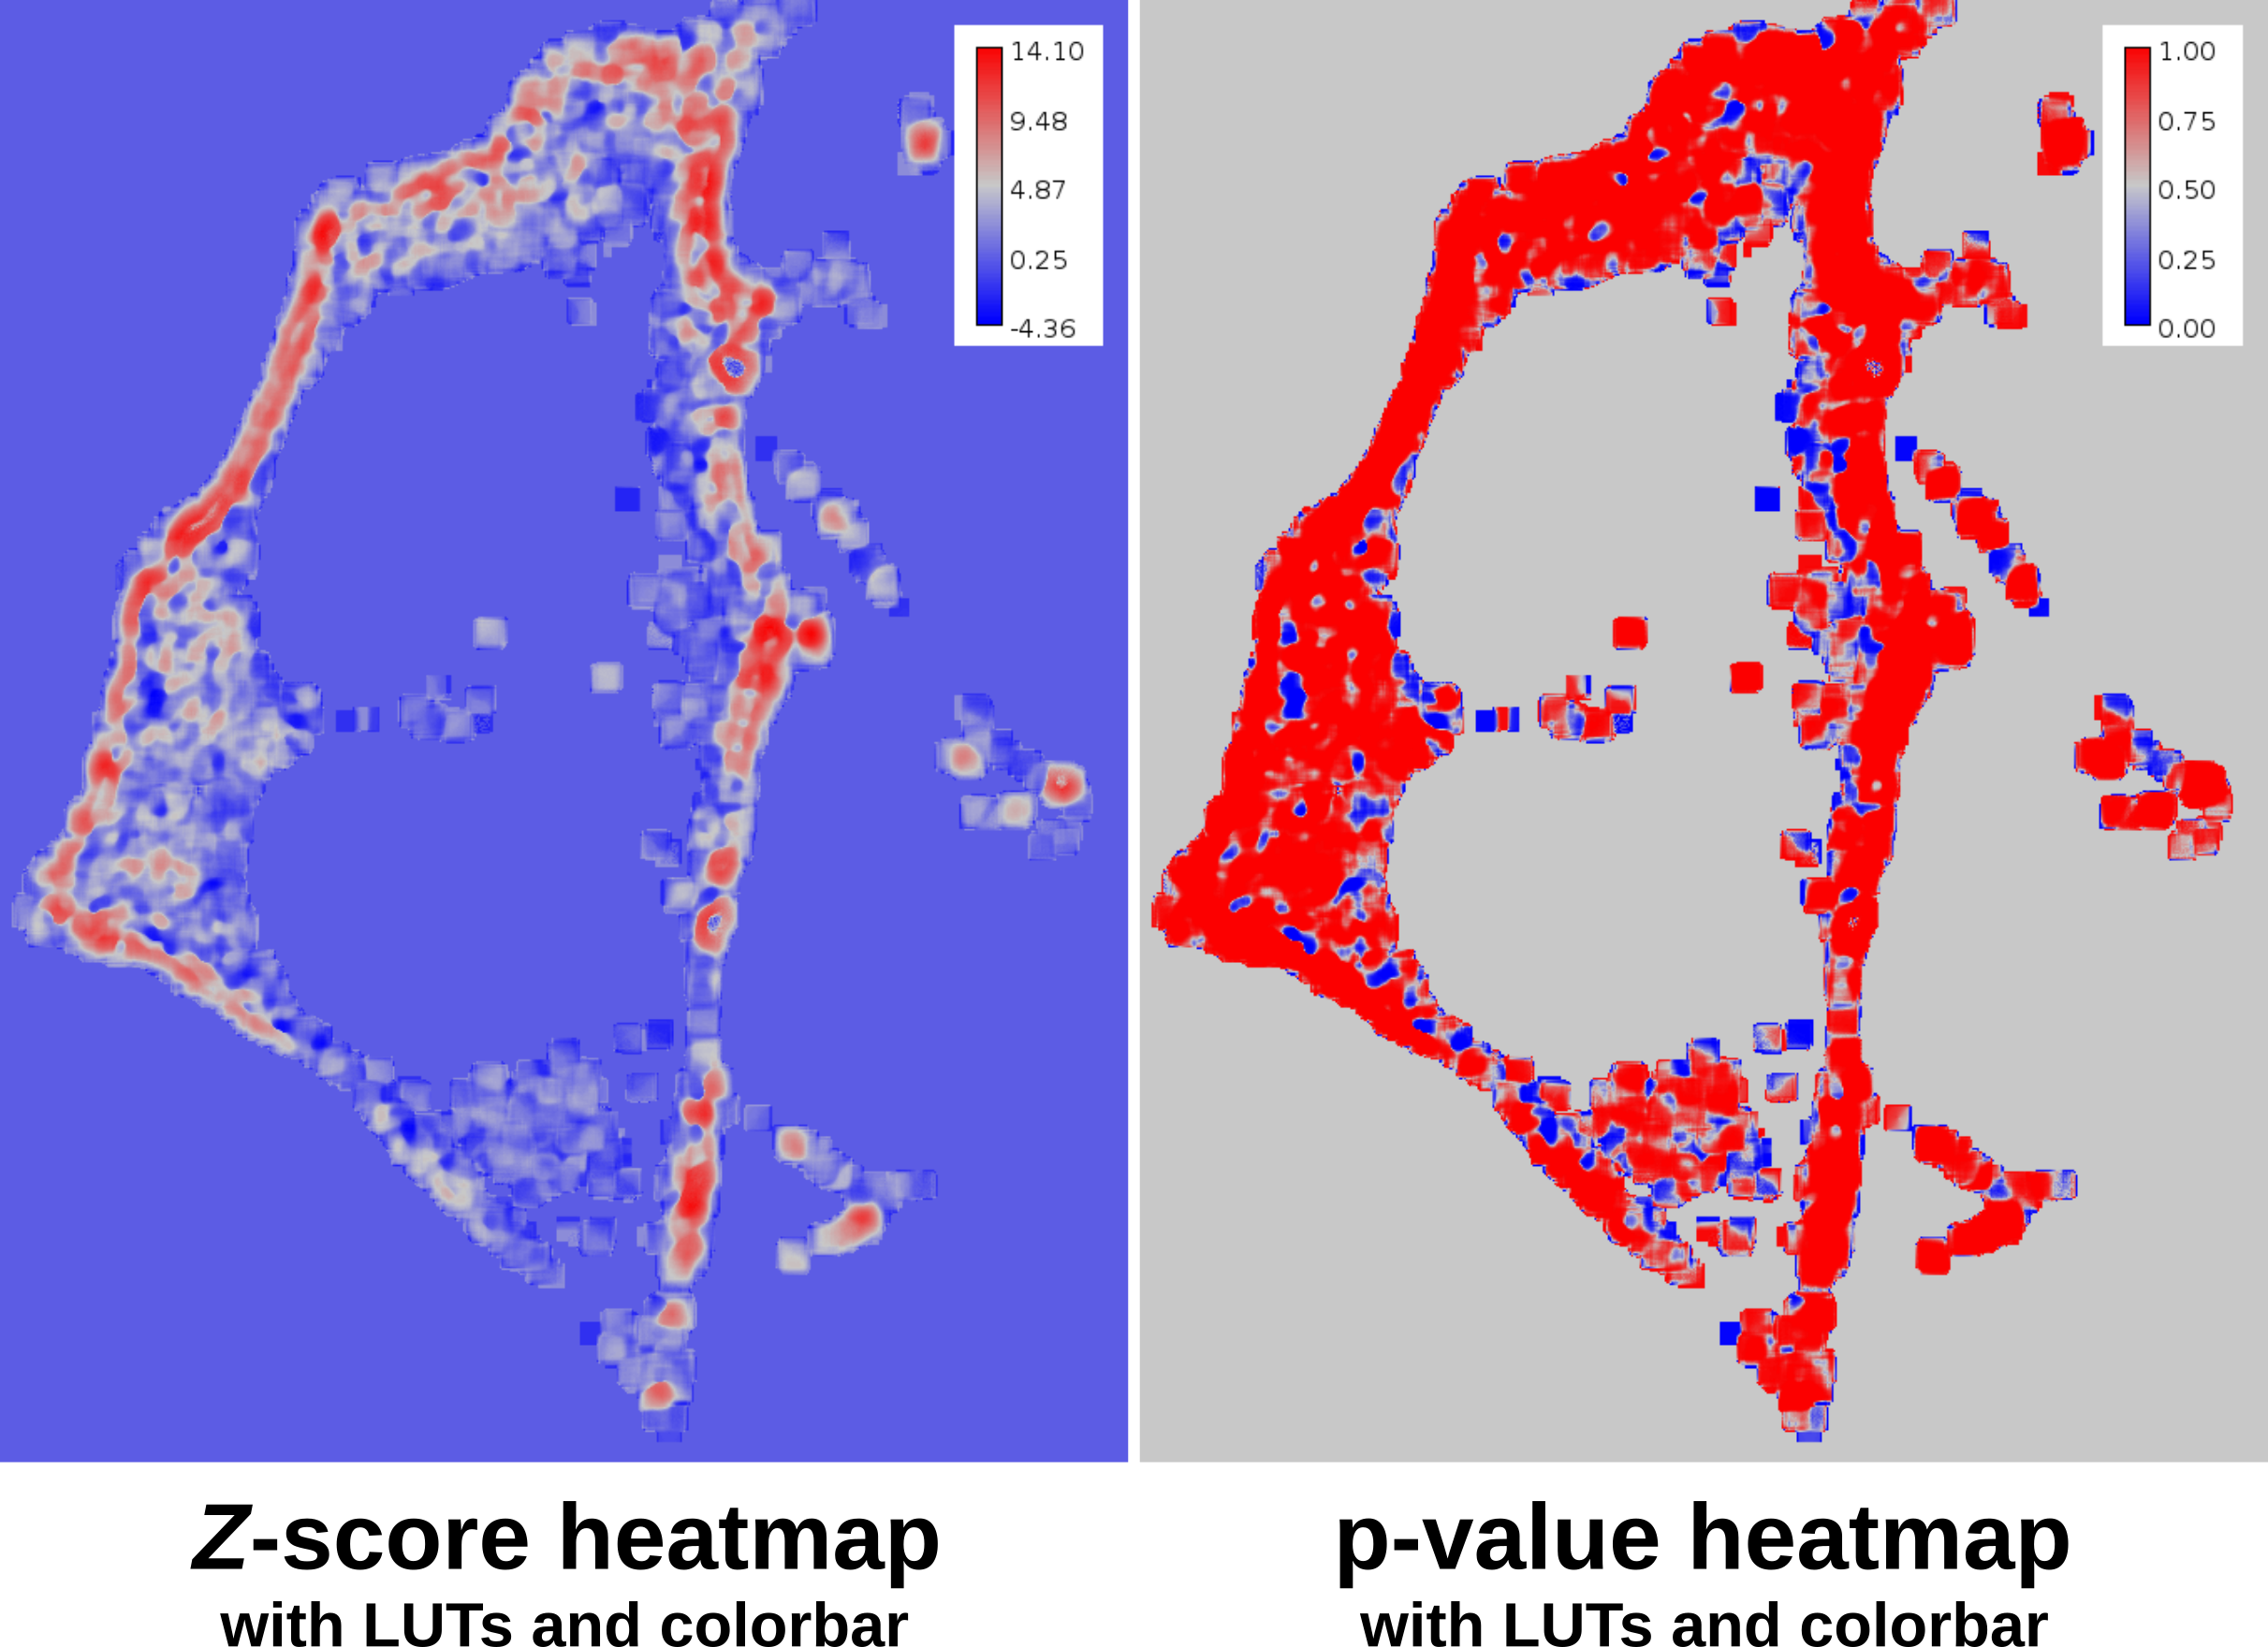
To apply the phase LUT and a colorbar use the following script and select the input images.
.. tabs::

   .. code-tab:: scijava-groovy

        #@ ImagePlus zscore_imp (label="Z-score heatmap")
        #@ ImagePlus pvalue_imp (label="p-value heatmap")

        import ij.IJ

        // apply phase LUT to input images
        IJ.run(zscore_imp, "phase", "")
        IJ.run(pvalue_imp, "phase", "")

        // apply color bar to images
        IJ.run(zscore_imp, "Calibration Bar...", "location=[Upper Right] fill=White label=Black number=5 decimal=2 font=12 zoom=1.3 overlay")
        IJ.run(pvalue_imp, "Calibration Bar...", "location=[Upper Right] fill=White label=Black number=5 decimal=2 font=12 zoom=1.3 overlay")

   .. code-tab:: python

        #@ ImagePlus zscore_imp (label="Z-score heatmap")
        #@ ImagePlus pvalue_imp (label="p-value heatmap")

        from ij import IJ

        # apply phase LUT to input images
        IJ.run(zscore_imp, "phase", "")
        IJ.run(pvalue_imp, "phase", "")

        # apply color bar to images
        IJ.run(zscore_imp, "Calibration Bar...", "location=[Upper Right] fill=White label=Black number=5 decimal=2 font=12 zoom=1.3 overlay")
        IJ.run(pvalue_imp, "Calibration Bar...", "location=[Upper Right] fill=White label=Black number=5 decimal=2 font=12 zoom=1.3 overlay")