I'm plotting the Nyquist diagram of a transfer function which has poles on the imaginary axis:
import control
import matplotlib.pyplot as plt
import numpy as np

K = 1

Gp =  control.tf([1], [1,1,0,0,0])
Gc = control.tf([K], [1])


control.nyquist_plot(Gp*Gc,plot=True,omega_num=1000)
plt.show()
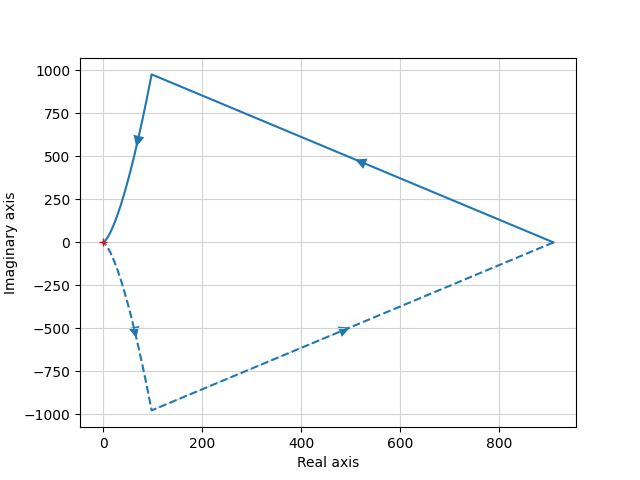
Which results in the following incorrect plot, that does not show infinte semicircles, but something incorrect:
Also using indent_direction and indent_radius did not solve this.
The trick I found that makes it work is if I add omega_limits=[0.001,10000] to nyquist_plot:

Can you please fix such that the incorrect 'line' does not appear?
I'm plotting the Nyquist diagram of a transfer function which has poles on the imaginary axis:
Which results in the following incorrect plot, that does not show infinte semicircles, but something incorrect:

Also using
indent_directionandindent_radiusdid not solve this.The trick I found that makes it work is if I add
omega_limits=[0.001,10000]to nyquist_plot:Can you please fix such that the incorrect 'line' does not appear?