Repository navigation
arrows in nyquist plot #303
Description

Recently, the Nyquist plot adds arrows to show the directions in the diagram. However, those arrows have always the same size and the same position. Working with my students, sometimes the arrows make difficult the correct interpretation of the Nyquist plots.
New options for the arrow size and position (not always the first and the last frequencies) could help to solve the issue .
Reacted by geekonloose and Pablo
Activity
geekonloose commentedon Mar 3, 2020
Yes, I am also experiencing this problem. Is there any hack to reduce the size of arrows?
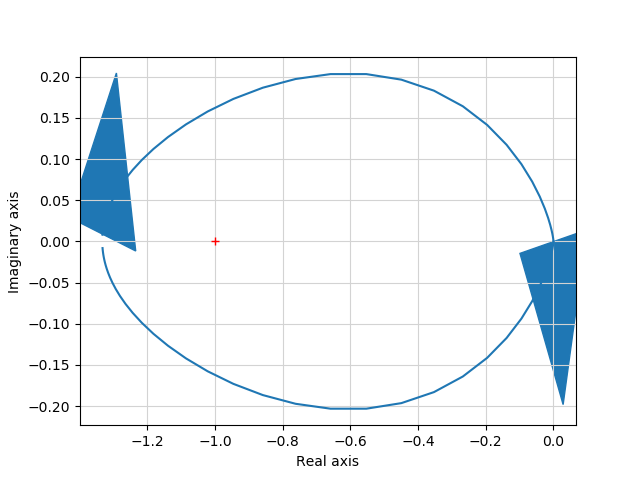
For example figure below,
murrayrm commentedon Mar 3, 2020
The problem seems to be that the arrow dimensions are based on the axis units rather than an "absolute" size (e.g., pixels). It should be relatively easy to add an option to
nyquist_plotto set the arrow size. Better would be to set the arrrow size so that it isn't in axis units.If someone wants to generate a PR for that, it would be useful. I won't have time to get to it for a while.
Quick hack: you might be able to get the
arrowobject withmatplotliband reset its size.murrayrm commentedon Mar 18, 2020
PR #379 provides a quick fix that allows the arrowhead size to be set manually.
A better algorithm that computes arrow head size automatically is still needed at some point. Arrow position is also not yet done in a good way.
kobemertens commentedon Aug 19, 2020
I'm not too familiar with the issue but the matplotlib documentation suggests using an annotation with an empty string as text like this:
Maybe this is worth looking into?
bnavigator commentedon Aug 19, 2020
Hi @SchrodingersCat00, that sounds like a good solution, especially since the current code also just adds a dummy straight line for the
arrowfrom the edges of the actual curve.python-control/control/freqplot.py
Lines 534 to 555 in f3e5035
Do you want to submit a PR for that?
murrayrm commentedon Feb 11, 2021
PR #534 fixes this issue.