Repository navigation
Behavior of hist() with normed=True changes from v2.0 to v2.1 #9557
Description

Found in the context of astropy/astropy#6786
When hist() is passed irregular bins with normed=True, the output is different between matplotlib 2.0 and 2.1. Here is a test script to reproduce the issue:
# Python 3.6
import matplotlib.pyplot as plt
import matplotlib
import numpy as np
rng = np.random.RandomState(829)

t = np.concatenate([rng.randn(100),
                    2 + 0.1 * rng.randn(100),
                    5 + 3 * rng.randn(100)])
plt.hist(t, bins=[-5, -3, -2, -1, -0.5, 0, 2, 4, 5, 10], normed=True)
plt.title(f'matplotlib v{matplotlib.__version__}')
plt.savefig(f'hist-{matplotlib.__version__}.png')
plt.show()hist-2.0.2.png:

hist-2.1.0.png:

Activity
tacaswell commentedon Oct 24, 2017
That seems very very bad.
If you do it 'by hand' which one is correct?
jklymak commentedon Oct 24, 2017
I think
ax.histwas changed to just pass through tonp.histogram, so if the "new" way is wrong, either the plotting is wrong ornumpyis wrong....jakevdp commentedon Oct 24, 2017
The 2.0.2 result matches what I would compute by-hand
jakevdp commentedon Oct 24, 2017
Note that the numpy
normedargument is known to be problematic with unequal bins, which is why it's being deprecated. If mpl2.1 changed to just passing normed through to numpy, that's likely the root of the issue. See https://docs.scipy.org/doc/numpy-1.13.0/reference/generated/numpy.histogram.htmljakevdp commentedon Oct 24, 2017
This seems to be the critical difference:
In mpl 2.1, the
normedparameter is transformed to thedensityparameter before being sent to numpy; see #8993I'm honestly not certain what the numpy
density=Trueoption does, but it seems to be something strange.jklymak commentedon Oct 24, 2017
https://github.com/numpy/numpy/blob/v1.13.0/numpy/lib/function_base.py#L432-L826
It seems to do what you are doing....
jakevdp commentedon Oct 24, 2017
@jklymak – thanks, you're right.
It looks like matplotlib 2.0
normed=Truematches numpydensity=True, while matplotlib 2.1normed=Truematches numpy's problematicnormed=True. Looking at the code, it's unclear to me why that is.jklymak commentedon Oct 24, 2017
My error, it is
hist2dthat just passes tonumpy. We have our ownhist. Yay! However, not sure what is up w/ numpy.Ours, you are supposed to use
densitynotnormed....jakevdp commentedon Oct 24, 2017
Here is a concise test case that passes in matplotlib 2.0, but not in 2.1 (tested with numpy 1.13.1):
jklymak commentedon Oct 24, 2017
What a mess:
jakevdp commentedon Oct 24, 2017
Here's the issue – in 2.1, the normalization is applied twice: once by matplotlib, and once by numpy: https://github.com/matplotlib/matplotlib/blob/v2.1.x/lib/matplotlib/axes/_axes.py#L6201-L6224
jakevdp commentedon Oct 24, 2017
The problematic lines seem to be removed already from master, though they are still in the 2.1.x branch.
jklymak commentedon Oct 24, 2017
Ha ha. Embarassingly, I even commented on it: #9121 Even more embarassingly, I hadn't updated that branch of master yet.
Someone should still probably talk to numpy about their "normed" kw!
3 remaining items
jakevdp commentedon Oct 24, 2017
I could open a PR with that test case – I suspect it will pass on master, and we could then back-port appropriate changes to 2.1.x
jklymak commentedon Oct 24, 2017
It’d be great to have a test w unequal bins.
tacaswell commentedon Oct 24, 2017
Did we backport what ever fixed this on master to 2.1.x? Re-opening to make sure that does not get lost (sorry if I am stepping on anyone's toes!).
jklymak commentedon Oct 24, 2017
#9121. Not sure if it was backported!
dstansby commentedon Oct 24, 2017
Huh, just thought I had removed old code, didn't realise that I'd accidentally fixed anything with that PR!
jakevdp commentedon Oct 26, 2017
It looks like both #9563 and #9586 have been merged and the appropriate code is backported to 2.1.x. That will resolve this issue once the next 2.1.x bugfix is released.
jakevdp commentedon Oct 26, 2017
Actually, #9586 hasn't been merged yet but the button is green if someone wants to do it 😄
dopplershift commentedon Oct 26, 2017
Merged. 🎉
mshonichev commentedon Mar 21, 2018
What exact version of matplotlib does contains the fix?
I ask, because it seems that I stuck onto that bug as well and I'm looking for a quick solution.
The code:
Ubuntu
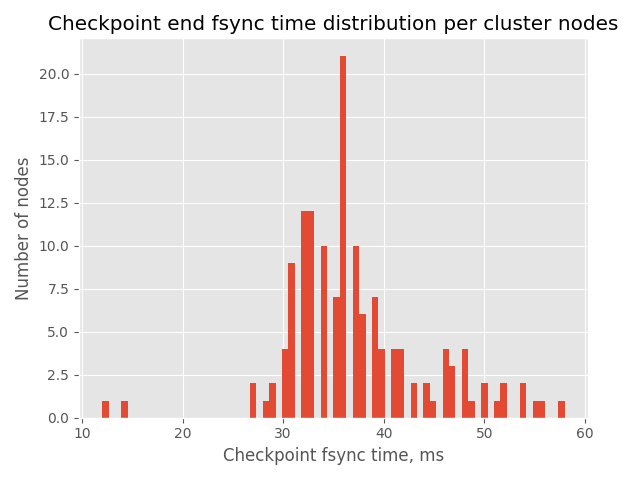
pandas (0.20.3)
numpy (1.13.1)
matplotlib (2.0.2)
gives proper graph as attach pic1.png
Centos

matplotlib (2.2.2)
numpy (1.14.2)
pandas (0.22.0)
gives incorrect pic2.png
Trying to play with bins or density=True/False gives no success, could you advice me a proper way to solve the issue?
jakevdp commentedon Mar 21, 2018
@mshonichev – this bug would only change things if you were using unevenly-spaced bins; I don't think it's related to the problem you're having.
mshonichev commentedon Mar 21, 2018
mmm... that might be exactly that case, the source data has only 144 points and they are not evenly distributed. Any workaround but for downgrading?
checkpoint-times.csv.txt
jklymak commentedon Mar 21, 2018
Can you open a new issue with a minimal (no extra calls) self contained example (no csv file)? But the normed kwarg is deprecated and I don’t know what passing zero in does.
jakevdp commentedon Mar 21, 2018
The relevant piece is the spacing of the bins, not the spacing of the data points.
Since you use
bins=72, the bins are evenly-spaced, and this issue will not be relevant to the bug you're seeing.I would open a new matplotlib issue to ask about this bug, but try to put together an example that others can run: the one above relies on reading a data file that is unavailable to anyone else – see http://matthewrocklin.com/blog/work/2018/02/28/minimal-bug-reports