You signed in with another tab or window. Reload to refresh your session.You signed out in another tab or window. Reload to refresh your session.You switched accounts on another tab or window. Reload to refresh your session.Dismiss alert
What Matplotlib version, Python version and Platform are you using? On Linux, python 3.5.2 and matplotlib master branch I get the figure below. Is that what you were expecting or not?
Hmm, this is working fine for me on 2.0.0 using python 3.6, in a fresh conda environment. What version of python are you using and what OS are you running?
On Fri, Feb 17, 2017 at 8:58 AM, David Stansby ***@***.***> wrote:
Hmm, this is working fine for me on 2.0.0 using python 3.6, in a fresh
conda environment. What version of python are you using and what OS are you
running?
—
You are receiving this because you are subscribed to this thread.
Reply to this email directly, view it on GitHub
<#8093 (comment)>,
or mute the thread
<https://github.com/notifications/unsubscribe-auth/AARy-Jkeml_KFqWjIhr02lnlnxmUqRJCks5rdad7gaJpZM4MEHDL>
.
Sorry I didn't provide this information. I see it with Python 2.7.13 using IPython 5.1.0.
When using plt.savefig I obtain the correct result mentioned by you above.
However, my example was not well chosen. The actual problem appears in this example (also when using plt.savefig without IPython):
However, maybe this is in fact not a bug but a feature, since this behavior guaranties a fixed aspect ratio of plots, which could be handy when generating multiple plots. I was just surprised that the axes can be longer than the given limits. But it can be a good thing that matplotlib sees them as lower limits with respect to the other axis. Maybe the current behavior is not a bad idea and no changes are actually required.
@fkbreitl Just to check, you edited the orginal post? I can not see a difference between the two examples...
I think the fundamental problem is that with a fixed aspect ratio the system is over constrained so we drop one of the constraints. The logic for all of this lives in apply_aspect, appears to have some special-casing for log scales, and would definitely benefit from better documentation!
I found this page searching for a solution to the same problem. Here is a code snippet:
for angle in range(0,180+step,step):
    .
    fig = plt.figure('Angle {0}'.format(angle))
    plt.plot(x,y,'-')
    # plt.gca().set_adjustable('box') # this didn't help
    plt.grid()
    plt.axis('equal')  # if this is removed, then plt.axis works
    plt.axis((-8.0,8.0,-8.0,8.0))
plt.show()
The x-axis was correct, but the y-axis autoscaled. Interestingly, if I tried to manually scale the y=axis (using the check mark on the displayed plot) the values would not be accepted when I pushed apply. Python 3.5.2, Matplotlib 1.5.3
Reacted by Nico Schlömer, Jan-Benedikt Jagusch, TheJCBand, Adam J. Stewart, Evgenii Neumerzhitckii, Qikai Gu, Feihong Liu (Reed), Desperate Morty, Tobia Marcucci, 360wcui and 2 more
@timhoffm@tacaswell hopefully this one is more demonstrative of the problem.
Anyways, I still couldn't find a proper automated fix for my problem, but managed to manually make everything correct.
Case 1
If I don't have two subplots, axis('equal') works fine.
Case 2
The automated code fails to work when you have two subplots. For some reason, it fixes a figure size (even if you don't give it one) and axis('equal') only works to change axis limits, hence cropping the plot.
Case 3
Manually chosing the figure size and subplot sizes first, depending on the data that is being plotted.
Case 4
Manually chosing the figure size and subplot sizes first, depending on the data that is being plotted. Then use axis('equal') to take care of finetuning in guessed size.
## Case 1

sp1 = plt.axes()

# Make a circle
h = sp1.plot(rotor_x,rotor_y,color = rotor_color)
sp1.set_ylabel('y (mm)')
# Make some dots
for i in range(len(dots)):
    sensor_cartesian = dots[i]
    hsens = sp1.scatter(sensor_cartesian[0],sensor_cartesian[1])
sp1.axis('equal')
sp1.text(0,0,'Case 1')

plt.savefig('Case_1.png',bbox_inches='tight')
Case 2/3/4 code
## Case 2/3/4:

case =4

if case==2:
    # For case 2, let axis equal do the job
    fig, [sp1,sp2] = plt.subplots(nrows=2, ncols=1, sharex='col'
                           ,gridspec_kw={'height_ratios': [3, 1]})
elif (case==3 or case==4):
    # For case 3 and 4, manually chose the figure size and subplot size
    fig, [sp1,sp2] = plt.subplots(nrows=2, ncols=1, sharex='col'
                                    ,gridspec_kw={'height_ratios': [y_size/z_size, 1]}
                                  ,figsize = (total_width,total_height)
                              )
# Make axis equal for case 2 or 4:
if (case==2 or case==4):
    sp1.axis('equal')
    sp2.axis('equal')

# Make a circle
h = sp1.plot(rotor_x,rotor_y,color = rotor_color)
sp1.set_ylabel('y (mm)')
sp2.set_xlabel('x (mm)')

# Make the corresponding rectangle
sp2.plot(rotor_x,rotor_z,rotor_x,-rotor_z,color = rotor_color)
sp2.plot(vert_x,vert_z,-vert_x,vert_z,color = rotor_color)
sp2.set_ylabel('z (mm)')

# Plot all the dots
for i in range(len(dots)):
    sensor_cartesian = dots[i]
    hsens = sp1.scatter(sensor_cartesian[0],sensor_cartesian[1])
    sp2.scatter(sensor_cartesian[0],sensor_cartesian[2],color = hsens.get_facecolor())


sp1.text(0,0,'Case %d'%case)
fig.savefig('Case_%d.png'%case,bbox_inches = 'tight')
A figure is always created with a fixed size. The figure may be created implicitly if necessary, when using pyplot. If not explicit size is given, it is taken from plt.rcParams['figure.figsize'].
Printing a figure w/ bbox_inches='tight'will resize the figure. And a lot of people do that implicitly when they use %matplotlib inline in ipython/jupyter notebooks. I think its a mistake for the inline backend to do that, because it leads to lots of confusion, but...
import matplotlib.pyplot as plt
import numpy as np

x = np.array([-20, -3, 0, 17])
y = np.array([0, -16, 16, 0])

fig, (ax1,ax2) = plt.subplots(nrows=2, ncols=1, sharex='col',
                              gridspec_kw={'height_ratios': [3, 1]})

ax1.set_aspect('equal', adjustable="datalim", share=True)
ax2.set_aspect('equal', adjustable="datalim", share=True)

h1, = ax1.plot(x, y)
h2, = ax2.plot(x, y / 4)
The problem: The lines are cut off. Now unlike other similar issues, which arise because the system is overconstrained, this is not the case here. The only constraints here are the equal aspect for both axes, and the sharing between the x axes. This would in principle still allow to adjust the x axis limits, such that the whole line is shown.
Yeah theoretically. But you’d need a constraint solver to figure it out. I’d say expecting sharing,autoscaling, and maintaining aspect across a number of axes is a pretty hard problem and you can either set up a big machinery to solve it or the user need not rely on autoscaling.
@jklymak The constraints aren't that complicated to solve, IMO. Just a bit of subtraction and division, as you can see from my O[10] lines of code in the second block in setup.
All plotting algorithms probably have the code structure that takes data range and uses those to implement the default axes limit. So now all they gotta do is take the grid-spec and figsize into account to decide the new axes limits.
@timhoffm Did you mean axis('scaled') ?
I tried it, but that one gave much more ridiculous results, so I abandoned it early on.
For folks who might encounter this problem later at some point, here's what you get if you replace axis('equal') by axis('scaled') in the above code, keeping everything else the same (I had to adjust the text location, but that's not the main point):
Let's not confuse things here. The figure size is fixed (bbox_inches="tight" does not change the figure size, it just renders on a larger/smaller pixel space). Anything that would change the figure size is on a totally different level. The issue isolated above is about the datalimits. Possibly this is hard, too, but I still need to convince myself of that.
The figure size is fixed (bbox_inches="tight" does not change the figure size, it just renders on a larger/smaller pixel space).
It renders a different figure size in inches, but if you mean it doesn't change the figure size parameter for calculation of the axes positions, I agree with that. (I wouldn't think in pixels, since that does often change on a savefig, and is irrelevant for many of the backends).

Activity
dstansby commentedon Feb 17, 2017
What Matplotlib version, Python version and Platform are you using? On Linux, python 3.5.2 and matplotlib master branch I get the figure below. Is that what you were expecting or not?
fkbreitl commentedon Feb 17, 2017
Sorry I forgot to mention I am using matplotlib 2.0.0 and the last command has no effect in my case.
So the y-axis remains from 5 to 8.
dstansby commentedon Feb 17, 2017
Hmm, this is working fine for me on 2.0.0 using python 3.6, in a fresh conda environment. What version of python are you using and what OS are you running?
WeatherGod commentedon Feb 17, 2017
fkbreitl commentedon Feb 17, 2017
Sorry I didn't provide this information. I see it with Python 2.7.13 using IPython 5.1.0.
When using plt.savefig I obtain the correct result mentioned by you above.
However, my example was not well chosen. The actual problem appears in this example (also when using plt.savefig without IPython):
However, maybe this is in fact not a bug but a feature, since this behavior guaranties a fixed aspect ratio of plots, which could be handy when generating multiple plots. I was just surprised that the axes can be longer than the given limits. But it can be a good thing that matplotlib sees them as lower limits with respect to the other axis. Maybe the current behavior is not a bad idea and no changes are actually required.
dstansby commentedon Feb 17, 2017
Yep, I can confirm that example doesn't seem to be working.
anntzer commentedon Feb 18, 2017
You need to call
plt.gca().set_adjustable("box"). See http://matplotlib.org/devdocs/api/_as_gen/matplotlib.axes.Axes.set_adjustable.html and http://matplotlib.org/devdocs/api/_as_gen/matplotlib.axes.Axes.set_aspect.html#matplotlib.axes.Axes.set_aspect. This could certainly be better documented though.tacaswell commentedon Feb 20, 2017
@fkbreitl Just to check, you edited the orginal post? I can not see a difference between the two examples...
I think the fundamental problem is that with a fixed aspect ratio the system is over constrained so we drop one of the constraints. The logic for all of this lives in
apply_aspect, appears to have some special-casing for log scales, and would definitely benefit from better documentation!fkbreitl commentedon Feb 20, 2017
@tacaswell The difference is that the first example respects the limits and the second doesn't.
If you say
apply_aspectcan help, then it would in fact be very useful to know how. The documentation is probably a very good place for that.tacaswell commentedon Feb 20, 2017
But I don't see how the examples are different, they are both
I suggest having a look at the source.
fkbreitl commentedon Feb 20, 2017
@tacaswell Oh, you are right. It seems like dstansby edited my example.
I think my original example was something like
beuse commentedon Apr 4, 2017
I found this page searching for a solution to the same problem. Here is a code snippet:
The x-axis was correct, but the y-axis autoscaled. Interestingly, if I tried to manually scale the y=axis (using the check mark on the displayed plot) the values would not be accepted when I pushed apply. Python 3.5.2, Matplotlib 1.5.3
tacaswell commentedon Apr 6, 2017
@beuse You want
ax.axis('square')I think.11 remaining items
aggna commentedon Aug 19, 2019
@timhoffm @tacaswell hopefully this one is more demonstrative of the problem.
Anyways, I still couldn't find a proper automated fix for my problem, but managed to manually make everything correct.
Case 1
If I don't have two subplots,

axis('equal')works fine.Case 2
The automated code fails to work when you have two subplots. For some reason, it fixes a figure size (even if you don't give it one) and
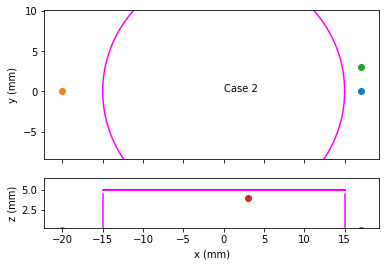
axis('equal')only works to change axis limits, hence cropping the plot.Case 3
Manually chosing the figure size and subplot sizes first, depending on the data that is being plotted.

Case 4
Manually chosing the figure size and subplot sizes first, depending on the data that is being plotted. Then use
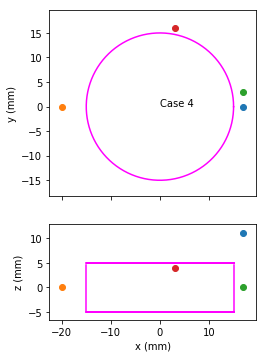
axis('equal')to take care of finetuning in guessed size.Attaching code.
Set up - no plotting yet
Case 1 code
Case 2/3/4 code
timhoffm commentedon Aug 22, 2019
@aggna This is correct and documented behavior.
plt.rcParams['figure.figsize'].axis('equal')scales the data limits to get the aspect right. See https://matplotlib.org/devdocs/api/_as_gen/matplotlib.pyplot.axis.html.axis('scale'))to resize the axes instead.jklymak commentedon Aug 22, 2019
Printing a figure w/
bbox_inches='tight'will resize the figure. And a lot of people do that implicitly when they use%matplotlib inlinein ipython/jupyter notebooks. I think its a mistake for theinlinebackend to do that, because it leads to lots of confusion, but...ImportanceOfBeingErnest commentedon Aug 23, 2019
I think I understand the issue. Minimal example:
The problem: The lines are cut off. Now unlike other similar issues, which arise because the system is overconstrained, this is not the case here. The only constraints here are the equal aspect for both axes, and the sharing between the x axes. This would in principle still allow to adjust the x axis limits, such that the whole line is shown.
So the expected outcome would be this:
jklymak commentedon Aug 23, 2019
Yeah theoretically. But you’d need a constraint solver to figure it out. I’d say expecting sharing,autoscaling, and maintaining aspect across a number of axes is a pretty hard problem and you can either set up a big machinery to solve it or the user need not rely on autoscaling.
aggna commentedon Aug 23, 2019
@ImportanceOfBeingErnest Yes, that's what I was thinking
axis('equal')would do. But alas!@timhoffm Thanks for clarifying the expected behaviour.
aggna commentedon Aug 23, 2019
@jklymak The constraints aren't that complicated to solve, IMO. Just a bit of subtraction and division, as you can see from my O[10] lines of code in the second block in setup.
All plotting algorithms probably have the code structure that takes data range and uses those to implement the default axes limit. So now all they gotta do is take the grid-spec and figsize into account to decide the new axes limits.
jklymak commentedon Aug 23, 2019
Sounds easy!
aggna commentedon Aug 23, 2019
@timhoffm Did you mean
axis('scaled')?I tried it, but that one gave much more ridiculous results, so I abandoned it early on.
For folks who might encounter this problem later at some point, here's what you get if you replace

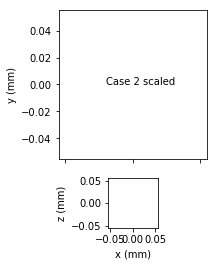
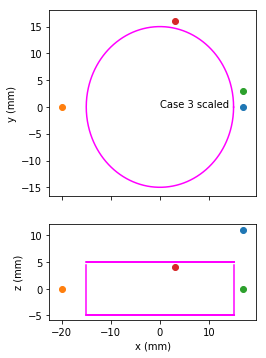
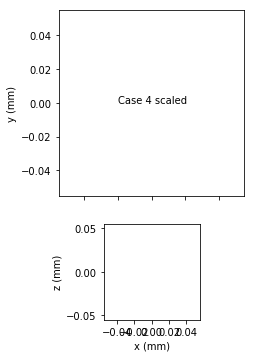
axis('equal')byaxis('scaled')in the above code, keeping everything else the same (I had to adjust the text location, but that's not the main point):ImportanceOfBeingErnest commentedon Aug 23, 2019
Let's not confuse things here. The figure size is fixed (bbox_inches="tight" does not change the figure size, it just renders on a larger/smaller pixel space). Anything that would change the figure size is on a totally different level. The issue isolated above is about the datalimits. Possibly this is hard, too, but I still need to convince myself of that.
jklymak commentedon Aug 23, 2019
It renders a different figure size in inches, but if you mean it doesn't change the figure size parameter for calculation of the axes positions, I agree with that. (I wouldn't think in pixels, since that does often change on a savefig, and is irrelevant for many of the backends).
Victor-Victorovich commentedon May 10, 2021
This worked for me. I had the same issue as OP.