Repository navigation
Matplotlib xtick appends .%f after %H:%M%:%S on chart #6037
Description

Python 3.4
Python 3 Matplotlib version is 1.4.2,
Python 3 Numpy version is 1.8.2
Reproduced with Python2.
Installed on Raspbian Linux Jessie (RaspberryPi). Both installed with apt-get.
I am creating a graph from a csv file that has the following format
08:21:05,41.0
08:22:05,41.0
08:23:05,41.0
The first column is the time (of course) and the second column is a centimetre measurement.
I am updating an application I wrote to measure sump pit waterlevel activity to Python3 which requires converting
the date from bytes to str as it was throwing an error. Accepted bytes fine under Python2.
The bytesdate2str function was courtesy github user cimarronm in another thread.
The graph gets created with the following code;
import time
import numpy as np
import matplotlib as mpl
mpl.use('Agg')
import matplotlib.pyplot as plt
import matplotlib.dates as mdates
from matplotlib import rcParams
rcParams.update({'figure.autolayout': True})

def bytesdate2str(fmt, encoding='utf-8'):
    '''Convert strpdate2num from bytes to string as required in Python3.

    This is a workaround as described in the following tread;
    https://github.com/matplotlib/matplotlib/issues/4126/

    Credit to github user cimarronm for this workaround.
    '''

    strconverter = mdates.strpdate2num(fmt)

    def bytesconverter(b):
        s = b.decode(encoding)
        return strconverter(s)
    return bytesconverter

def graph(csv_file, filename, bytes2str):
    '''Create a line graph from a two column csv file.'''

    unit = 'metric'
    date, value = np.loadtxt(csv_file, delimiter=',', unpack=True,
                             converters={0: bytes2str}
                             )
    fig = plt.figure(figsize=(10, 3.5))
    fig.add_subplot(111, axisbg='white', frameon=False)
    rcParams.update({'font.size': 9})
    plt.plot_date(x=date, y=value, ls='solid', linewidth=2, color='#FB921D',
                  fmt=':'
                  )
    title = "Sump Pit Water Level {}".format(time.strftime('%Y-%m-%d %H:%M'))
    title_set = plt.title(title)
    title_set.set_y(1.09)
    plt.subplots_adjust(top=0.86)

    if unit == 'imperial':
        plt.ylabel('inches')
    if unit == 'metric':
        plt.ylabel('centimeters')

    plt.xlabel('Time of Day')
    plt.xticks(rotation=30)
    plt.grid(True, color='#ECE5DE', linestyle='solid')
    plt.tick_params(axis='x', bottom='off', top='off')
    plt.tick_params(axis='y', left='off', right='off')
    plt.savefig(filename, dpi=72)


csv_file = "file.csv"
filename = "today.png"

bytes2str = bytesdate2str('%H:%M:%S')
graph(csv_file, filename, bytes2str)
Using matplotlib for Python 3 I had to convert the date from bytes to str which is what the function bytesdate2str does.
However the time on the x axis now appends .%f to the end. I have been able to find some documentation on the matplotlib site around date formatting
but I am having trouble figuring out how to remove that .%f
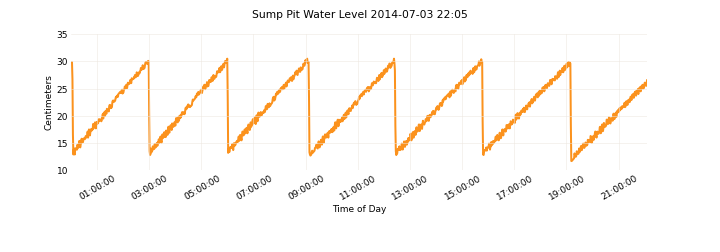
Here is what the xticks looked like before without converting to str in python2.
Here is what the xticks looks like after converting from bytes to str (under both Python2 and 3)
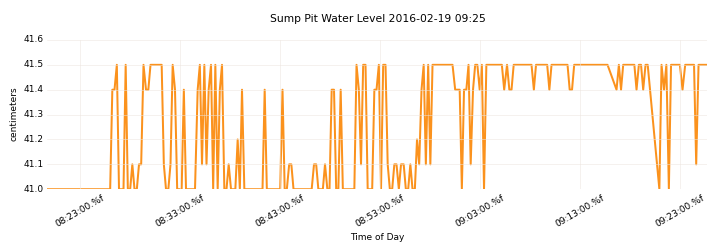
How do I remove %f from the end of the time? This is the only thing I have used matplotlib for and am a novice when it comes
to the package. Appreciate any insight you can provide.
Activity
tacaswell commentedon Feb 21, 2016
The two graphs you have are not strictly the same in one very important way, they have different domains. What I think is going on here is that the default data formatter looks at the x-range and tries to guess the best format should be (and these default strings will be change in v2.0 (and be controlled via rcparam)). In the bottom graph it is as small enough range mpl is selecting the finest-grained format which includes fractions of a second. For what ever reason, the date formatting is failing and leaving the %f in (not sure why).
The simplest work around is to just remove
%ffrom then set of allowed format strings.tacaswell commentedon Feb 21, 2016
Another fun bread crumb to track, because there is no date, datetime thinks the date is in 1900
And I can not reproduce this issue with mpl 1.5.x + py3.5
alaudet commentedon Feb 21, 2016
tacaswell commentedon Feb 21, 2016
Closing as there is a work-around and this is a duplicate of #3179 which was closed by #3242 These changes are in v1.5.0 +