Repository navigation
fire/ice blue/yellow bipolar colormap #6033
Description

There are several variations of this theme in existence:
- http://www.neurobiologyofaging.org/article/S0197-4580(09)00296-6/
- http://www.mathworks.com/matlabcentral/fileexchange/26026-bipolar-colormap
- http://www.mathworks.com/matlabcentral/fileexchange/24870-fireice--hot-cold--colormap
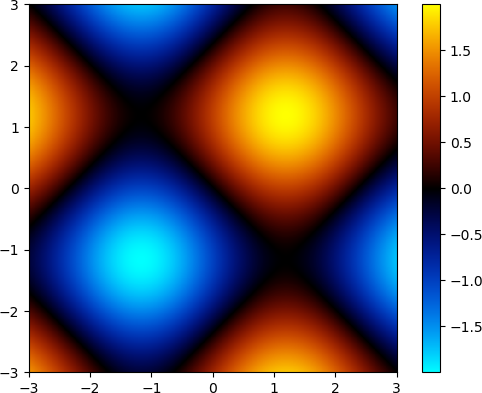
I made one using bezier curves to reduce banding:


It does have a sharp angle at the midpoint causing a black band for 0, but that's intentional because it's for diverging data. (would be best with #1806) Here it is with a wavelet scalogram:

Like Ged Ridgway's, the midpoint brightness can be changed, with gray for surface plots, etc:

and color order flips if midpoint is brighter than gray:

Would this be good for inclusion, either as a (cleaned-up) function or as a single fixed map?
Activity
Tillsten commentedon Feb 20, 2016
The top-image is playing tricks with my eyes. I could really use it, i use 'bwr' all the time and wouldnt mind a little bit more color dynamic. (Time-resolved difference spectroscopy)
tacaswell commentedon Feb 20, 2016
I am tentatively 👍 on including the black center and white center version over a single generation function.
The pros of just including the maps is that the cognitive load for users is low, but the con is low flexibilty.
The pro of adding the function is high flexibility, but also very high cognitive load / low discoverability. If you have a nice function to generate these maps, it might be better to integrate that into viscm (@njsmith @stefanv)
How do these colormap fare under the in luminosity linearity / color blind metrics?
For reference, these are the diverging color maps we currently ship:
njsmith commentedon Feb 20, 2016
This is just designed by picking solve corners of the RGB cube and interpolating between them, which is not a design method that I'm particularly fond of -- but matplotlib has all kinds of more or less well designed colormaps in it so I'm not sure what the bar is. It would certainly make sense to at least stick it through
viscm view.endolith commentedon Feb 20, 2016
Well, if it were included as a function, it would be similar to the existing cubehelix function. Generates a fixed map out of the box, but can be accessed as a function if someone wants to generate a variation.
... Though now that I look at it, cubehelix isn't as easy to use as I expected. I thought you could do
from matplotlib._cm import cubehelixand thencubehelix()would produce a LinearSegmentedColormap directly, but it only produces the RGB curves and has to be processed by_generate_cmapfirst. Maybe there should be a user-accessiblematplotlib.cm.cubehelix_function()or something that calls_cm.cubehelix()and_generate_cmap()for you.Yep. But cyan and yellow are similar in perceptual lightness so it works pretty well. Here it is in Lab/Lch space:
Here's what happens in RGB space when the midpoint is changed:
Ideally matplotlib would have colorspace conversion abilities built-in and then we could do maps like this and color_scale as functions.
endolith commentedon Feb 20, 2016
got viscm working:
efiring commentedon May 2, 2016
@endolith Maybe use viscm to flatten out the perceptual deltas? I really want to see a better set of colormaps like this made readily available for mpl--which might be by direct inclusion, or via an import-- but I don't want it to hold up 2.0, so I am moving the goalpost.
endolith commentedon Aug 11, 2018
FYI https://github.com/bokeh/colorcet provides 3 perceptually-smooth bipolar black-center maps now:
bky:bkr:gkr:vs my bezier
bipolar:choldgraf commentedon Aug 11, 2018
Is anything in the license preventing us from bringing them into Matplotlib?
endolith commentedon Aug 11, 2018
License is CC-BY-4.0, and BSD does not require attribution? So I'm not sure. https://opensource.stackexchange.com/a/344/9996
endolith commentedon Aug 11, 2018
I got viscm working again
(for my own future reference:
)
bky:bkr:gkr(not for color-blind obviously):bipolar(neutral=0):bipolar(neutral=1):bipolar(neutral=0.3):14 remaining items
anntzer commentedon Aug 12, 2018
twilight was merged in #6254, and I think we should really think about #6254 (comment) before adding any new colormaps, regardless of their merits. Copied here (from @njsmith):
njsmith commentedon Aug 12, 2018
@endolith Oh, I see. A background assumption I was making was that you want a perceptually uniform colormap, which means that in your final 3d curve all the points are equally spaced. Your "g" and "m" plots don't have this property – the spaces between the dots are quite visibly different at different parts of the curve.
Again, you could potentially argue that you don't want to stick strictly to this constraint, but you should at least realize when you aren't :-)
Yeah, the CIECAM02 equivalent to Lab is CAM02-UCS, whose coordinates are J'/K, a', b'. (The authors of that paper did not think these names through.) This is a Cartesian coordinate system. The equivalent of LCh is... "CAM02-UCS, converted to cylindrical coordinates". It doesn't have its own name, but it's just the grade school rectangular/polar conversion.
endolith commentedon Aug 12, 2018
Oh, so specifically, you mean the Euclidean distance (in CAM02-UCS space) between each sample is equal?
Ok, that's helpful, I'll try to figure this out.
njsmith commentedon Aug 12, 2018
Exactly.
anntzer commentedon Nov 7, 2018
There was some discussion some time ago about making it easier for people to generate their own packages for distributing custom colormaps (this way not everything has to go into matplotlib directly); having just had to write one (for my own use) I put together https://github.com/anntzer/matplotlib-cmap-template.
(Yes, I know about cookiecutter and I actually quite like using that myself, but in this specific case I thought the template was just simple enough to not pick up a dependency on a templating system. If there's demand I can still make a cookiecutter for it though...)
choldgraf commentedon Nov 7, 2018
very cool @anntzer , thanks for sharing!
timhoffm commentedon Nov 9, 2018
@anntzer Nice! Two suggestions:
I would call it
register_cmap(). That's more explicit and in a package in which the colormap is not the main topic, it's more clear what this does.Not quite sure if the
__init__example is good. I'd rather not have these in production code as this is cutter. Also, it's not an ideal example because it does not demonstrate how the to use the lib from your external code (as opposed to the exsample in the readme).anntzer commentedon Nov 9, 2018
Done.
Uh? You mean
__main__?I don't see it as an example, but as some mildly useful functionality ("what was this colormap again?"); the docs should live (IMO) in the README or the docstring.
timhoffm commentedon Nov 9, 2018
Yes, sorry (auto-type in my fingers...).
Ok, let's say +/-0 on
__main__anntzer commentedon Feb 7, 2019
My proposition is to close this, encourage @endolith to publish the cmap as an independent PyPI package (for example (but not necessarily, of course) relying on the package template mentioned just above), and possibly link it back in the docs.
jklymak commentedon Feb 7, 2019
I agree w/ this.... plus the new colormap tutorial hopefully makes making custom colormaps easier... https://matplotlib.org/tutorials/colors/colormap-manipulation.html#sphx-glr-tutorials-colors-colormap-manipulation-py