Skip to content

Offset text positions not implemented #4476

Open

Description

@joferkington

There currently isn't any method of controlling where offset text for an axis gets placed. This causes problems when changing tick locations (e.g. tick_top and tick_right).

Axis.offset_text_position appears to have been intended to be the control, but changing ax.xaxis.offset_text_position and ax.yaxis.offset_text_position has no effect. Furthermore, there doesn't appear to be a code path where offset_text_position is used, or any other mechanism for changing the offset text's position. XAxis._update_offset_text_position (and the equivalent in YAxis) will need to be updated to take this into account.

Consider the following example:

import numpy as np
import matplotlib.pyplot as plt

x = np.linspace(0, 1e8)
y = np.exp(x**0.2)

fig, ax = plt.subplots()
ax.plot(x, y)

ax.xaxis.tick_top()
ax.yaxis.tick_right()

plt.show()

figure_1

In this case, the 1e17 corresponds to the y-axis, while the 1e8 corresponds to the x-axis. Ideally, these should be aligned so that it's clear which axis they correspond to.

For the y-axis, we can move the offset text to the left-hand side, but it will still be in a position that overlaps with the x-axis's ticklabels. Regardless, there's no corresponding method for the x-axis. As an example:

import numpy as np
import matplotlib.pyplot as plt

x = np.linspace(0, 1e8)
y = np.exp(x**0.2)

fig, ax = plt.subplots()
ax.plot(x, y)

ax.xaxis.tick_top()
ax.yaxis.tick_right()
ax.yaxis.set_offset_position("right")

plt.show()

figure_1

Note: Originally noticed by user3160855 in a Stackoverflow question.

Activity

  1. added this to the milestone on May 26, 2015
  2. joferkington commented on May 26, 2015

    @joferkington
    ContributorAuthor

    As an example of one possible implementation (using monkey-patching to demonstrate the proof-of-concept instead of a "full" pull request):

    import types
    
    import numpy as np
    import matplotlib.pyplot as plt
    
    import matplotlib.transforms as mtransforms
    
    def main():
        x = np.linspace(0, 1e8)
        y = np.exp(x**0.2)
    
        fig, ax = plt.subplots()
        ax.plot(x, y)
    
        monkey_patch(ax.xaxis, x_update_offset_text_position)
        monkey_patch(ax.yaxis, y_update_offset_text_position)
    
        ax.xaxis.tick_top()
        ax.yaxis.tick_right()
        ax.xaxis.offset_text_position = "top"
        ax.yaxis.offset_text_position = "right"
    
        plt.show()
    
    def monkey_patch(axis, func):
        axis._update_offset_text_position = types.MethodType(func, axis)
    
    def x_update_offset_text_position(self, bboxes, bboxes2):
        x, y = self.offsetText.get_position()
    
        if self.offset_text_position == 'bottom':
            if bboxes:
                bbox = mtransforms.Bbox.union(bboxes)
            else:
                bbox = self.axes.bbox
            y = bbox.ymin - self.OFFSETTEXTPAD * self.figure.dpi / 72.0
            self.offsetText.set(va='top', ha='right')
    
        else:
            if bboxes2:
                bbox = mtransforms.Bbox.union(bboxes2)
            else:
                bbox = self.axes.bbox
            y = bbox.ymax + self.OFFSETTEXTPAD * self.figure.dpi / 72.0
            self.offsetText.set(va='bottom', ha='left')
    
        self.offsetText.set_position((x, y))
    
    def y_update_offset_text_position(self, bboxes, bboxes2):
        x, y = self.offsetText.get_position()
    
        if self.offset_text_position == 'left':
            # y in axes coords, x in display coords
            self.offsetText.set_transform(mtransforms.blended_transform_factory(
                    self.axes.transAxes, mtransforms.IdentityTransform()))
    
            top = self.axes.bbox.ymax
            y = top + self.OFFSETTEXTPAD * self.figure.dpi / 72.0
    
        else:
            # x & y in display coords
            self.offsetText.set_transform(mtransforms.IdentityTransform())
    
            # Northwest of upper-right corner of right-hand extent of tick labels
            if bboxes2:
                bbox = mtransforms.Bbox.union(bboxes2)
            else:
                bbox = self.axes.bbox
            top, right = bbox.ymax, bbox.xmax
            x = right + self.OFFSETTEXTPAD * self.figure.dpi / 72.0
            y = top + self.OFFSETTEXTPAD * self.figure.dpi / 72.0
    
        self.offsetText.set_position((x, y))
    
    main()
    

    figure_1

  3. modified the milestones: , on Jul 16, 2015
  4. soupault commented on Jan 14, 2016

    @soupault
    Contributor

    This also affects the case when several axes are placed on the same side of the plot.

    For example,

    fig, axes = plt.subplots(nrows=2, ncols=2, sharex=True)
    axes = axes.T.flatten()
    axes_r = [ax.twinx() for ax in axes]
    axes_s = [ax.twinx() for ax in axes]
    ...
    for idx in range(len(axes)):
        ...
        axes_s[idx].spines['right'].set_position(('axes', 1. + 0.055))
    
        axes[idx].yaxis.get_major_formatter().set_powerlimits((-1, 1))
        axes_r[idx].yaxis.get_major_formatter().set_powerlimits((-1, 1))
        axes_s[idx].yaxis.get_major_formatter().set_powerlimits((-1, 1))
    

    image

  5. tacaswell commented on Jan 14, 2016

    @tacaswell
    Member

    @soupault Any chance we could get you to turn @joferkington 's patch into a PR?

  6. soupault commented on Jan 26, 2016

    @soupault
    Contributor

    @tacaswell Sorry, I'm not familiar with the source code at all. I can start to work on the PR in free time, but can't promise it any time soon.

  7. maxnoe commented on May 18, 2017

    @maxnoe
    Contributor

    This is still an issue in matplotlib 2.0

    Any news on this?

  8. modified the milestones: , on Oct 3, 2017
  9. efojs commented on Feb 7, 2020

    @efojs

    Also with multiple axis. Either with parasite axes (demo 1, demo 2) or with spines.

    E.g. here ylim of Velocity is set to 6.5e7:
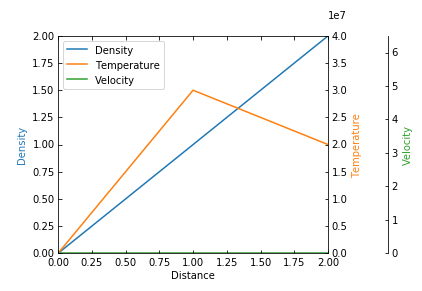
    image

    Is there any built-in solution other than _update_offset_text_position and set_visible(False)?

    v3.1.2

  10. tacaswell commented on Feb 7, 2020

    @tacaswell
    Member

    I do not beleive so. This needs a champion to pick up the proposed patch, write some tests for it, write some documentation for it and get the PR through.

  11. 3 remaining items

  12. oscargus commented on Apr 13, 2023

    @oscargus
    Member

    Current status:

    image

    Since there is a patch that may solve it (although it can require a bit of work to adapt), and it is still a bit of an issue I reopen it.

  13. QuLogic commented on Dec 1, 2023

    @QuLogic
    Member

    See https://discourse.matplotlib.org/t/overlapping-of-scientific-notation-exponents-with-twin-axes/24145/4?u=qulogic for the same problem with twinned Axes and offset Spines.

    The following patch seems to work for that case, but I would need to investigate further if it might break something or the change should go elsewhere:

    diff --git a/lib/matplotlib/axis.py b/lib/matplotlib/axis.py
    index 56d4e6b77d..773a95ad2a 100644
    --- a/lib/matplotlib/axis.py
    +++ b/lib/matplotlib/axis.py
    @@ -2558,8 +2559,7 @@ class YAxis(Axis):
             self.offsetText.set(
                 x=0, y=0.5,
                 verticalalignment='baseline', horizontalalignment='left',
    -            transform=mtransforms.blended_transform_factory(
    -                self.axes.transAxes, mtransforms.IdentityTransform()),
    +            transform=mtransforms.IdentityTransform(),
                 fontsize=mpl.rcParams['ytick.labelsize'],
                 color=tick_color
             )
    @@ -2646,6 +2646,8 @@ class YAxis(Axis):
                 bbox = self.axes.spines['outline'].get_window_extent()
             else:
                 bbox = self.axes.bbox
    +            spine_bbox = self.axes.spines[self.offsetText.get_ha()].get_window_extent()
    +            x = spine_bbox.x0
             top = bbox.ymax
             self.offsetText.set_position(
                 (x, top + self.OFFSETTEXTPAD * self.figure.dpi / 72)

    It also probably needs to be replicated for XAxis.

  14. github-actions commented on Dec 2, 2024

    @github-actions

    This issue has been marked "inactive" because it has been 365 days since the last comment. If this issue is still present in recent Matplotlib releases, or the feature request is still wanted, please leave a comment and this label will be removed. If there are no updates in another 30 days, this issue will be automatically closed, but you are free to re-open or create a new issue if needed. We value issue reports, and this procedure is meant to help us resurface and prioritize issues that have not been addressed yet, not make them disappear. Thanks for your help!

  15. added
    status: closed as inactiveIssues closed by the "Stale" Github Action. Please comment on any you think should still be open.
    on Jan 3, 2025
  16. reopened this on Jan 3, 2025
  17. added
    keepItems to be ignored by the “Stale” Github Action
    and removed
    status: inactiveMarked by the “Stale” Github Action
    on Jan 3, 2025
  18. removed
    status: closed as inactiveIssues closed by the "Stale" Github Action. Please comment on any you think should still be open.
    on Jan 4, 2025
  19. ctjlewis commented on Feb 15, 2025

    @ctjlewis

    This is still an issue.

Sign up for free to join this conversation on GitHub. Already have an account? Sign in to comment

Metadata

Metadata

Assignees

No one assigned

    Labels

    New featurekeepItems to be ignored by the “Stale” Github Actionstatus: has patchpatch suggested, PR still needed

    Type

    No type

    Projects

    No projects

      Relationships

      None yet

      Development

      No branches or pull requests

      Issue actions