Repository navigation
Tick label padding on first y-axis changes when adding a second y-axis #4346
Description

When I have just the right set of commands, the tick label padding on the first y-axis changes when I add a second y-axis. Here are my minimal working examples.
This set of commands
import matplotlib as mpl
import matplotlib.pyplot as plt

fig = plt.figure()
ax1 = plt.subplot()
ax1.plot(range(2),range(2))
ax1.yaxis.set_tick_params(which = 'major', direction = 'out', \
    labelsize = mpl.rcParams['font.size'], size = mpl.rcParams['ytick.major.size'])
fig.savefig('No_Issue1.png')
produces a figure that looks fine to me:

This set of commands,
fig = plt.figure()
ax1 = plt.subplot()
ax1.plot(range(2),range(2))
ax2 = ax1.twinx()
fig.savefig('No_Issue2.png')
also produces a figure that looks fine, even after adding a second y-axis:

This set of commands
fig = plt.figure()
ax1 = plt.subplot()
ax1.plot(range(2),range(2))
ax1.yaxis.set_tick_params(which = 'major', direction = 'out', \
    labelsize = mpl.rcParams['font.size'], size = mpl.rcParams['ytick.major.size'])
ax2 = ax1.twinx()
fig.savefig('Issue.png')
however, messes with the tick label padding on the first y-axis:

Apparently, the following commands
ax1.yaxis.set_tick_params(which = 'major', direction = 'out', \
    labelsize = mpl.rcParams['font.size'], size = mpl.rcParams['ytick.major.size'])
ax2 = ax1.twinx()
do not play nice together.
In case it matters, I am on matplotlib 1.4.0
Activity
tacaswell commentedon Apr 17, 2015
If you reverse the order
It works correctly.
@stretch97 You seem to have a talent for finding really odd subtle bugs.
breedlun commentedon Apr 17, 2015
Talent?! I think of it as a curse. =)
Anyways, thanks for the temporary work around.
yongzhez commentedon Feb 29, 2016
When debugging this, I noticed that autoscale_view when plot is called causes the problem. I'm on matplotlib 2.x branch and I get the following problem below.

This happens after the below code is called in autoscale_view:
Is this is a new bug that popped up? if so, what would be considered a decent fix for autoscale_view?
yongzhez commentedon Feb 29, 2016
I was wondering if auto_scale is actually even needed in plot. I managed to have the below graph just by removing it

tacaswell commentedon Feb 29, 2016
I think this is only working with out
autoscale_viewbecause the data limits are [0, 1], which also happen to be the default view limits.Autoscaling the limits (with the margins) is one of the big style changes for 2.0 so that functionality needs to remain.
It also looks like the last image you posted still shows the extra space between the tick labels and the ticks on the left axes.
Merge pull request #6079 from paulkirow/master
Merge pull request #6079 from paulkirow/master
Merge pull request matplotlib#6079 from paulkirow/master
efiring commentedon Jan 26, 2018
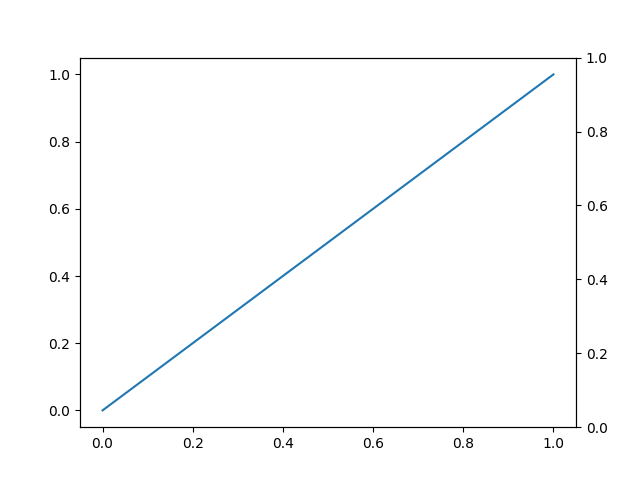
I'm closing this because the original problem above seems to be gone now. Reopen if I have misunderstood. With
I get
breedlun commentedon Jan 26, 2018
Yes, the problem does appear to be gone. Thank you to whomever inadvertently solved it!