Repository navigation
[Bug]: wspace and hspace in subfigures not working #25511
Description

Bug summary
wspace and hspace in Figure.subfigures do nothing.
Code for reproduction
import matplotlib.pyplot as plt

figs = plt.figure().subfigures(2, 2, wspace=0, hspace=0)
for fig in figs.flat:
    fig.subplots().plot([1, 2])
plt.show()
Actual outcome
Same figure independently of the values of hspace and wspace.
Expected outcome
matplotlib/lib/matplotlib/figure.py
Lines 1550 to 1554 in b3bd929
Additional information
No response
Operating system
OS/X
Matplotlib Version
3.7.1
Matplotlib Backend
MacOSX
Python version
Python 3.10.9
Jupyter version
No response
Installation
conda
Activity
rcomer commentedon Mar 20, 2023
Thanks for the report @maurosilber. The problem is clearer if we set a facecolor for each subfigure:
With
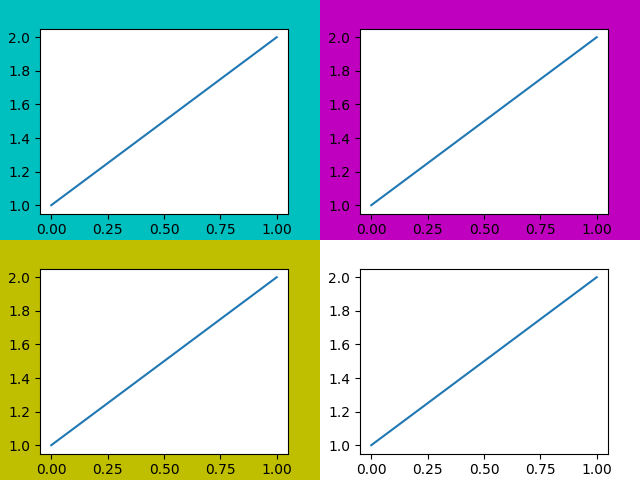
main, both figures look likeMiguel-LlamasLanza commentedon Mar 20, 2023
Just to add something, it looks like it works when using 'constrained' layout.
jklymak commentedon Mar 21, 2023
The relevant code is
matplotlib/lib/matplotlib/figure.py
Line 2237 in 0b4e615
This didn't break - it never worked. I imagine the position logic could be borrowed from Axes....
dswelch commentedon Mar 25, 2023
I am a first time contributer, and would like to attempt to work on this if possible! Will get a PR in the coming days
dswelch commentedon Mar 29, 2023
I have been trying to understand the code associated with this and have run into some issues.
In the function _redo_transform_rel_fig (linked above), I feel that I would have to be able to access all of the subfigures within this figure in order to give the correct amount of space based on the average subfigure width/height. Would this be possible?
I have been looking to this function as inspiration for the logic, but I am still trying to understand all the parameters as well:
matplotlib/lib/matplotlib/gridspec.py
Line 145 in 0b4e615
tacaswell commentedon Mar 29, 2023
There is a
fig.subfigsattribute which is a list of theSubFiguresin aFigure.dswelch commentedon Apr 4, 2023
Apologies for the slow progress, had a busier week than expected.
Below is the code I am running to test.
This creates two figures, one with constrained layout and one without. Below is my current output.

On the right is the constrained layout figure, and the left is the one without.
My code currently fits the facecolors in the background to the correct spots, however the actual graphs do not match. They seem to need resizing to the right and upwards in order to match the constrained layout. Would a non-constrained layout figure be expected to resize those graphs to fit the background? I would assume so but I wanted to check since I couldn't find the answer in the documentation I looked at.
jklymak commentedon Apr 4, 2023
I'm not quite sure what you are asking here? Constrained layout adjusts the axes sizes to fit in the figure. If you don't do constrained layout the axes labels can definitely spill out of the figure if you just use default axes positioning.
rcomer commentedon May 20, 2023
I've been digging into this. We have a test that adds a subplot and a subfigure using the same gridspec, and the subfigure is expected to ignore the wspace on the gridspec.
matplotlib/lib/matplotlib/tests/test_figure.py
Lines 1425 to 1439 in ffd3b12
The use-case envisioned in the test seems entirely reasonable to me, but I'm struggling to see how we can support that while also fixing this issue.
jklymak commentedon May 22, 2023
Why do you say the subfigure is expected to ignore the wspace? I don't see that wspace is set in the test.
rcomer commentedon May 22, 2023
Since no wspace is passed, I assume the gridspec will have the default from rcParams, which is 0.2.
jklymak commentedon May 23, 2023
Sure, but I don't understand what wouldn't work in that example with
wspaceargument. Do you just mean that the default would be too large for this case?rcomer commentedon May 23, 2023
Yes, I think in the test example, if both subfigure and subplot were respecting the 0.2 wspace then the left-hand subplots would be narrower and we’d have more whitespace in the middle. Currently in this example the total width of the two lefthand subplots looks about the same as the width of the righthand one, so overall the figure seems well-balanced.
Another test here explicitly doesn’t expect any whitespace between subfigures, though in this case there are no subplots so you could just pass
wspace=0, hspace=0to the gridspec and retain this result.matplotlib/lib/matplotlib/tests/test_figure.py
Lines 1368 to 1388 in 8293774
jklymak commentedon May 23, 2023
Can we just make the default wspace for subfigures be zero?
rcomer commentedon May 23, 2023
wspaceis a property of the gridspec. Do you mean we should have a separate property for subfigures, e.g.GridSpec.subfig_wspace, with its own default?jklymak commentedon May 23, 2023
gridspecis still public API, but barely, as there are usually more elegant ways to do the same things that folks used to use gridspecs for.In this case, as you point out, it is better if subplots and subfigures get different wspace values, even if they are the same grid spec level. I'm suggesting that subfigures ignores the grid spec wspace (as it currently does) and if we want a wspace for a set of subfigures that be a kwarg of the subfigure call.
However, I never use wspace nor hspace, and given that all these things work so much better with constrained layout, I'm not sure what the goal of manually tweaking the spacing is.
rcomer commentedon May 23, 2023
OK, how’s this? #25960