Repository navigation
[Doc]: bar examples should probably not have "score by ... gender" in them... #23352
Description

Documentation Link
https://matplotlib.org/devdocs/gallery/index
Problem
Our very first examples have "scores by gender" in them. I don't think this adds anything to the examples and is easy to make more generic.
Suggested improvement
No response
Reacted by hannah and Noa Tamir
Activity
Shubham-100 commentedon Jun 28, 2022
Hey @jklymak, I am a newcomer, I would like to take this up. Do you want "scores by gender" to be removed or...?
jklymak commentedon Jun 28, 2022
Yes, come up with some other binary identifier that ideally is not related to intrinsic human characteristics, and recast the examples. Bonus points if its something obvious, intuitive, and fun....
jklymak commentedon Jun 28, 2022
I would also highlight this one as needlessly political: https://matplotlib.org/devdocs/gallery/showcase/bachelors_degrees_by_gender.html, though that would take some more research to find nice time series...
mwaskom commentedon Jul 9, 2022
I've always thought this was a funny one — when this dataset came out it was interesting for showing that growth in CS was on trend up to the early 80s before suddenly reversing as an outlier. But in the matplotlib example, CS is drawn in a light gray and very easy to miss. Redrawing the example like in the NPR article (showing fewer majors and emphasizing CS) would be a more interesting example ... though also political I suppose.
story645 commentedon Jul 12, 2022
I like this example cause I'm a data point (CS or engineering depending on how they coded), which is why I find calling it political a bit I dunno depressing. The example should probably be updated to include more recent data, and possibly contextualized w/ the numbers for men and folks of other genders (if that data is available) but I dunno if it's inherently controversial and I really don't think it's saying anything that's out of line w/ Matplotlib values.
jklymak commentedon Jul 12, 2022
I think the examples should show folks how to use matplotlib and maybe tentatively wade into the controversial subject of how to effectively and pleasingly portray data. Any other commentary should be put somewhere else.
SourajitaDewasi commentedon Jul 19, 2022
Hi @jklymak
I am a beginner and I wanted to contribute to open source specifically to Matplotlib that I use regularly in my data analysis projects. I think an example that is not political or not controversial could be five groups from different countries: G1, G2, G3, G4, G5 and if they like tea or coffee.
Or five age groups and if they are comfortable with in-person communication or online communication.
scottshambaugh commentedon Jul 22, 2022
Here's a list of the specific examples which are affected:
SourajitaDewasi commentedon Jul 24, 2022
Hi @jklymak and @scottshambaugh
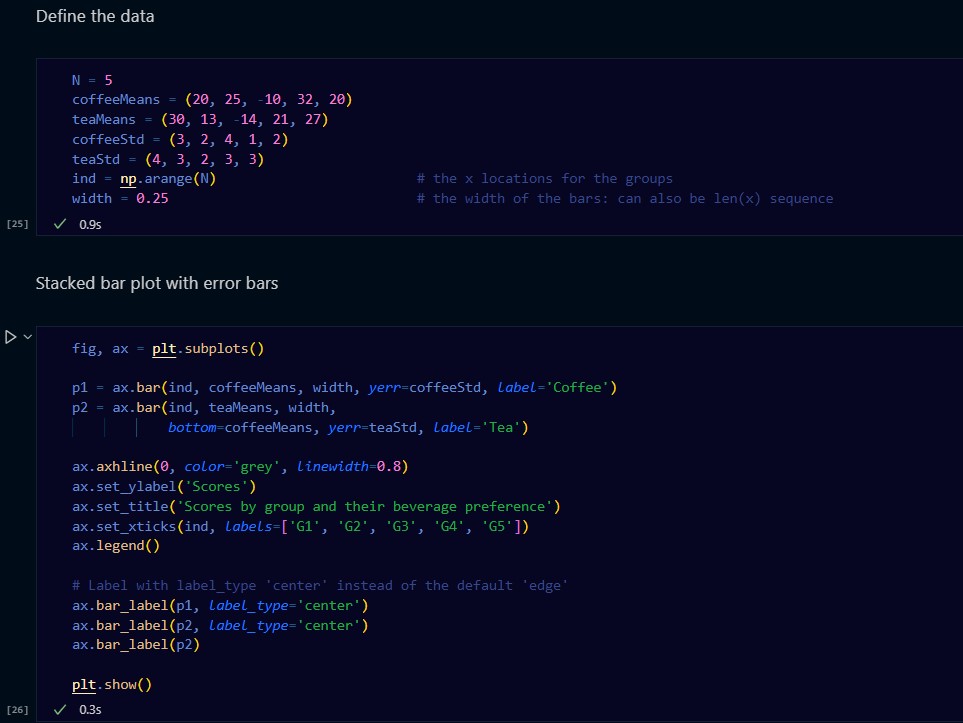
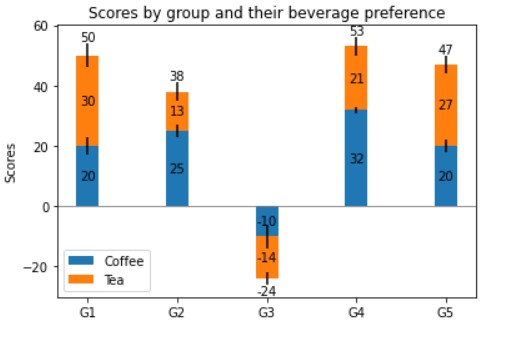
With the following code I was able to obtain this result. I am inserting both the images below. This is just for the bar_label_demo example. Can you please guide me how to move from here?
Thanks in advance!
jklymak commentedon Jul 24, 2022
This seems fine, though who knows how controversial Tea/Coffee will be ;-)
https://matplotlib.org/stable/devel/index.html describes how to make pull requests...
SourajitaDewasi commentedon Jul 25, 2022
Thank you @jklymak . I will complete this as soon as possible!
story645 commentedon Sep 22, 2022
I think was closed w/ #23590
QuLogic commentedon Sep 22, 2022
Seems like it.