Repository navigation
3d animations - plot is layered - does not obscure objects by depth. #17147
Description

Bug report
In 3d plotting and animations - the plot is layered - as it does not obscure objects by depth.
In the example below we have 60 lines and 60 points to update each frame. The lines and dots are updated in a loop each frame.
- As each line is updated it is plotted on top of the existing figure
- Objects in the foreground should obscure objects in the background.
- Bug: the lines/points are updated in 2D layers, and the resulting image has no 3D effect.
Below is an image comparing the output from matlab and python with one of these images.

The matlab plot properly obscures objects by depth whereas python does not.
Bug summary
Code for reproduction
The bug can be seen in the following animation:
Download the script objects1.py and include it in the same directory as the following:
# Paste your code here
import numpy as np
import matplotlib.pyplot as plt
import mpl_toolkits.mplot3d.axes3d as p3
import matplotlib.animation as animation
from objects1 import *

# INITIALIZE FIGURE ###################################################


def genFigure(f, d):
    # # colour range for first frame
    # col = d[:, :, 0] * 0.5 + 0.5
    # generate the 2-sphere for plot animation
    x, y, z = generateSphere()
    # Attaching 3D axis to the figure
    f1 = plt.figure()
    # 3d axes
    ax = p3.Axes3D(f1)
    ax.axis('equal')
    ax.view_init(30, 30)
    # draw sphere
    ax.plot_surface(0.5 * x + 4, 0.5 * y + 4, 0.5 * z,
                    rstride=1, cstride=1, color='c', alpha=0.6, linewidth=0)
    # initialize the plot
    l1 = [ax.plot(fib[2, :], fib[1, :], fib[0, :],
                  linestyle="-", linewidth=10)[0] for fib in f[0]]                                  # fibers
    p1 = [ax.plot(0.5 * dat[0, 0:1] + 4, 0.5 * dat[1, 0:1] + 4, 0.5 * dat[2, 0:1],
                  linestyle="", marker="o", markersize=5)[0] for dat in d ]                         # points
    # plot parameters
    ax.set_xlim(-2.1, 2.1)
    ax.set_ylim(-2.1, 2.1)
    ax.set_zlim(-2.1, 2.1)
    # Grid off
    plt.axis('off')
    plt.grid(b=None)
    return f1, l1, p1

# UPDATE FIGURE #####################################################


def update_bundle(num, fiberLines, lines, dataPoints, pts):
    for line, fibers, point, data in zip(lines, fiberLines[num], pts, dataPoints):
        # fiber and point colour
        col = data[:, num] * 0.5 + 0.5
        # update the points
        point.set_data(0.5*data[0:2, num]+4)
        point.set_3d_properties(0.5*data[2, num])
        point.set_color(col)
        # update the fibers
        line.set_data(fibers[1:, :])
        line.set_3d_properties(fibers[0, :])
        line.set_color(col)
    return lines + pts

# MAIN SCRIPT ########################################################


config = {"nPoints": 20,        # number of points per band
          "nFrames": 2 ** 8,    # number of frames in the sequence
          "rotations": 24,      # complete rotations per sequence along central axis
          "fiberRes": 300}      # number of points per fiber line

# FIBER BUNBLES
# h = Hopf(config) returns a Hopf class where:
# h.fiber is a list of config["nFrames"] elements, containing the fibers
# in a array of dimension [config["nPoints"], 3, config["fiberRes"]]
# h.s2path is an array of dimension [config["nPoints"], 3] containing
# the 3d unit sphere coordinates corresponding to each fiber
h = Hopf(config)

# initialize the figure
fig, lines, points = genFigure(h.fiber, h.s2path)

# animate the figure
ani = animation.FuncAnimation(fig,
                              update_bundle,
                              frames=config["nFrames"],
                              fargs=(h.fiber, lines, h.s2path, points),
                              interval=1,
                              blit=True,
                              repeat=False)

# show plot
plt.show()
Actual outcome
Lines/points are layered according to their printing order:

Expected outcome
The lines should be nested, and obscured by 3D depth, as shown in the matlab plot.
Matplotlib version
- Operating system: Ubuntu 18.04
- Matplotlib version: 2.1.1
- Matplotlib backend (
print(matplotlib.get_backend())): TkAgg - Python version: 3.6.9
Activity
timhoffm commentedon Apr 15, 2020
This is a fundamental limitation. mplot3d is not a true 3D renderer, it does only a layered 2D with some heuristics what to draw on top. Mutually overlapping objects cannot be handled. Additionally, the draw-order heuristic can fail sometimes. See also #5830 and issues linked there.
mo-geometry commentedon Apr 15, 2020
Okay - I didn't realize it's a fundamental limitation.
Is that to suggest that it cannot be updated to create 3d plots with depth?
As it is - matplotlib is a reasonably good 3D renderer, it would be a shame not to update it and remove this limitation.
timhoffm commentedon Apr 15, 2020
It's reasonably good at pretending to display 3D but it is not a 3D renderer. A true 3D renderer would essentially be a completely new project and we neither have the capacity nor the intention to extend into that direction.
There's now way to support mutually overlapping objects since we cannot draw partial objects. I.e. this cannot be done using
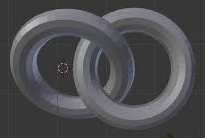
plot():For some other cases like scattered dots, it works reasonably (or can be made to work reasonably, c.f. #15594, #5830 (comment)).
See also FAQ My 3D plot doesn't look right at certain viewing angles
mo-geometry commentedon Apr 15, 2020
Okay - thanks Tim!