Repository navigation
Legend text alignment renders differently for pdf and png #15497
Description

Legend text alignment renders poorly for pdf
Alignment of text seems to work well in interactive plot and png, but does not look good in pdf
Following the basic text alignment recipe of Paul Ivanov, SO #7936034.
Code for reproduction
import matplotlib.pyplot as plt

fig, ax = plt.subplots(figsize=(3.5, 2.75))
ax.semilogy([1, 2, 3], [1, 2, 3], label='$\Lambda = 50$ m')
ax.semilogy([1, 2, 3], [1.5, 3, 4.5], label='40 m')
ax.semilogy([1, 2, 3], [2, 4, 6], label='30 m')

leg = ax.legend(loc = (0.59, 0.65), fontsize=12, framealpha=1)

#Code from SO#7936034
shift = max([t.get_window_extent(renderer=fig.canvas.get_renderer()).width for t in leg.get_texts()])
for t in leg.get_texts():
    t.set_ha('right') # ha is alias for horizontalalignment
    t.set_position((shift,0))

# png looks the way it does in interactive plot, but pdf renders poorly
#fig.savefig('leg_test.pdf')
fig.savefig('leg_test.png')
Actual outcome
leg_test.pdf
Expected outcome

Matplotlib version
- Operating system: MacOS
- Matplotlib version: 3.1.0
- Matplotlib backend (
print(matplotlib.get_backend())): MacOSX - Python version: 3.7.3
- Jupyter version (if applicable):
- Other libraries:
Standard conda install
Reacted by Lucas Sawade and Leandro Hermida
Activity
timhoffm commentedon Oct 23, 2019
Could it be that this reserves space for the latex source string
$\Lambda = 50$ minstead of the space required for the rendered versionΛ = 50 m?jklymak commentedon Oct 23, 2019
I think it’s that window_extent is in pixels and the dpi changes
nedlrichards commentedon Oct 30, 2019
I have found a relatively unrelated example that has almost identical behavior. I thought I would include it here, but please let me know if I should open a new report.
The pdf renders off of the plot:
test.pdf
While the png renders correctly:
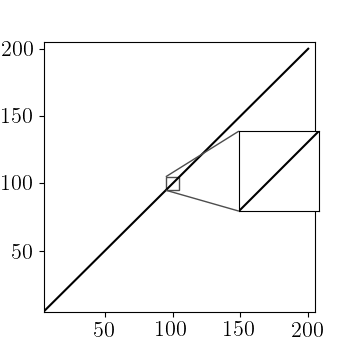
Thank you for all of your help on this. The solution to this problem isn't time sensitive, but I do think it is interesting.
jklymak commentedon Oct 30, 2019
Can you specify your dpi in the png?
nedlrichards commentedon Oct 30, 2019
Current dpi is default (100.0). Changing the dpi to a non-default:
Same code as above, with
This requires the specification of a new bbox_to_anchor
The png looks mostly the same (except larger). The pdf is attached, but looks generally the same as last upload.
test.pdf
ImportanceOfBeingErnest commentedon Oct 30, 2019
I would recommend specifying the bounding box not in pixels, but in units relative to the axes or figure. This should be shown in the inset locator demo.
nedlrichards commentedon Oct 30, 2019
Thank you @ImportanceOfBeingErnest , relative units resolved this issue for the inset locator.
jklymak commentedon Oct 30, 2019
The issue here is that for pixel-based positions, PDF is rendered as 72 dpi, regardless of what you set the figure dpi to, or set the
dpioption ofsavefigto. The png follows the figure dpi unless you change the dpi in the save fig command. You can easily test this by setting the png to 72 dpi and see that you get the identical result to the PDF. Note that changing the dpi of the pdf has no effect (unless you rasterize an artist, in which case it is rasterized at the dpi set by savefig)As @ImportanceOfBeingErnest says, you should avoid positioning things in pixels if you want the results to be consistent between output formats.
nedlrichards commentedon Oct 30, 2019
Following the advice of @jklymak ,this one line code change fixed the original issue (legend misalignment).
I am happy to chalk this up as a feature and not a bug. Thank you all for your help with understanding the differences between pixel and vector graphics and
savefig.jklymak commentedon Oct 30, 2019
I think the docs are pretty confusing in this regard. There is no fundamental reason the PDF and PS backends needed to be written with a fixed 72 dpi; yes, PDF specifies pen location in points, but we could handle that conversion in the backend and reduce a lot of incompatibility....
See a list of similar issues in the past: #9220
hermidalc commentedon Apr 2, 2022
@jklymak @ImportanceOfBeingErnest could you explain how to change the OP code example below, to right align legend text in its box, using the suggestion you've given above?
jklymak commentedon Apr 2, 2022
I'll close this because pixel placement is working as expected (ie it doesn't work if you mix renderers). Further discussion can be moved to discourse.matplotlib.org, but in general transform your pixels to inches using fig.dpi_scale_trans and then the shift should be dpi agnostic.
hermidalc commentedon Apr 2, 2022
@jklymak I came upon this issue today because I'm having the same problem as the OP even in latest matplotlib 3.5.1. Right aligning text in the legend using the standard method shown in OP example below doesn't right align properly when saving to pdf but works perfectly for png etc. What am I doing wrong?
hermidalc commentedon Apr 2, 2022
@jklymak sorry to bother, but I'm searching for a while and cannot seem to find how to do it, how do you do the above suggestion with the OP example right align text legend code I referenced?
hermidalc commentedon Apr 2, 2022
I tried using
fig.dpi_scale_transin the way I thought it would work, but it still doesn't workjklymak commentedon Apr 2, 2022
@hermidalc My apologies - I thought it would be as easy as setting a transform, but it is not, because legends are done with boxes that are the width of their children (
Hapacker), and you can't just simply change the transform to move the contents around like you can for normal artists.So, the hack in the original post is not robust, and a proper fix would be a feature request. Someone would have to do a deep dive into legend to make it so that the boxes that go into HPackers can have a minimum width that could then be set post-facto, ideally in non-pixel units. I don't think giving
HPackers a minimum width is that hard, but there isn't an easy way to do that without some new API in the guts of legend. Also legends do a lot in display units (pixels), so its a minor miracle they work at all with multiple dpi changes a figure can go through.hermidalc commentedon Apr 2, 2022
It's always fun and interesting to hear about API internals! No worries, but glad this is a known issue. Matplotlib is really a very powerful library and it's rare when something like this pops up, so kudos to you and rest of core team.
hermidalc commentedon Apr 2, 2022
Btw I did the workaround mentioned here when wanting to savefig pdf to make sure to not change figure default dpi=100, then the legend text positioning and alignment works better, though it's not quite exactly as aligned as exact same code with png there's still some very minor error there
hermidalc commentedon Apr 2, 2022
@jklymak btw, why isn’t there an easier way to specify to right align legend labels/text in matplotlib? That would be maybe an easier feature to implement.
jklymak commentedon Apr 3, 2022
Because legend was implemented in a relatively flexible but complex way, and the surrounding architecture does not have an align-right feature. Someone who wanted it would have to dig in and figure it out.
github-actions commentedon Jun 28, 2023
This issue has been marked "inactive" because it has been 365 days since the last comment. If this issue is still present in recent Matplotlib releases, or the feature request is still wanted, please leave a comment and this label will be removed. If there are no updates in another 30 days, this issue will be automatically closed, but you are free to re-open or create a new issue if needed. We value issue reports, and this procedure is meant to help us resurface and prioritize issues that have not been addressed yet, not make them disappear. Thanks for your help!