Repository navigation
colorbar shows no ticks for decreasing norms #12665
Description

Bug report
Bug summary
When using a decreasing Norm, colorbars show no ticks.
Code for reproduction
This example uses a PowerNorm-like norm which first applies the power, then does linear rescaling to (0, 1) (as opposed to matplotlib's PowerNorm which first linearly rescales to (0, 1) then applies the power) -- as argued in #10234 the behavior here is often more desirable, though that's not the point of this bug report.
PNorms with a negative gamma are decreasing (the builtin PowerNorm wouldn't work here because the first linear rescaling step would put the minimum to zero, which doesn't like being raised to a negative power...).
from matplotlib import pyplot as plt
from matplotlib.colors import Normalize
import numpy as np


class PNorm(Normalize):
    def __init__(self, vmin=None, vmax=None, clip=False, *, gamma):
        super().__init__(vmin=vmin, vmax=vmax, clip=clip)
        self.gamma = gamma

    def __call__(self, value, clip=None):
        if clip is None:
            clip = self.clip
        result, is_scalar = self.process_value(value)
        self.autoscale_None(result)
        vmin, vmax = self.vmin, self.vmax
        gamma = self.gamma
        if vmin > vmax:
            raise ValueError("minvalue must be less than or equal to maxvalue")
        elif vmin == vmax:
            result.fill(0)
        else:
            if clip:
                mask = np.ma.getmask(result)
                result = np.ma.array(np.clip(result.filled(vmax), vmin, vmax),
                                     mask=mask)
            resdat = result.data
            resdat = resdat ** gamma
            resdat -= min(vmin ** gamma, vmax ** gamma)
            resdat /= abs(vmax ** gamma - vmin ** gamma)
            result = np.ma.array(resdat, mask=result.mask, copy=False)
        if is_scalar:
            result = result[0]
        return result

    def inverse(self, value):
        if not self.scaled():
            raise ValueError("Not invertible until scaled")
        if np.iterable(value):
            return np.vectorize(self.inverse)(value)
        else:
            vmin, vmax = self.vmin, self.vmax
            gamma = self.gamma
            return (value * abs(vmax ** gamma - vmin ** gamma)
                    + min(vmin ** gamma, vmax ** gamma)) ** (1 / gamma)


fig, axs = plt.subplots(1, 2)
im = axs[0].imshow(np.arange(1., 101.).reshape((10, 10)), norm=PNorm(gamma=2))
fig.colorbar(im, ax=axs[0])
im = axs[1].imshow(np.arange(1., 101.).reshape((10, 10)), norm=PNorm(gamma=-2))
fig.colorbar(im, ax=axs[1])

plt.show()
(as a side note, creating new norms is a bit ridiculously verbose)
Actual outcome
left is gamma=2, right is gamma=-2.

Expected outcome
Some ticks on the right (gamma=-2) colorbar.
Matplotlib version
- Operating system: Arch Linux
- Matplotlib version: 3.0.1
- Matplotlib backend (
print(matplotlib.get_backend())): any - Python version: 3.7
Activity
jklymak commentedon Oct 29, 2018
Did this ever work or did we break something?
anntzer commentedon Oct 29, 2018
Doesn't work at least as far back as 1.5.3.
jklymak commentedon Oct 29, 2018
OK, maybe we've never supported non-fixed ticks for colorbars w/ arbitrary norms.
The approriate check is
matplotlib/lib/matplotlib/colorbar.py
Line 508 in ad779b4
If you make that True, it does an OK job of labeling the ticks, but they are equally scaled between 1 and 100 and you probably want a logarithmic scaling, or an arbitrary scale? As pointed out before, we don't have arbitrary scales for axis, so thats a bit messy. I think you have to do something by hand here.
Happy to discuss improving this API. Two different issues:
See #11859 for arbitrary scale discussion.
anntzer commentedon Oct 29, 2018
Indeed, I forgot to mention another point which is that the colorbar should give equal space to each "unit-of-color" (rather than unit-of-unscaled value), similarly to what it currently does for LogNorm:
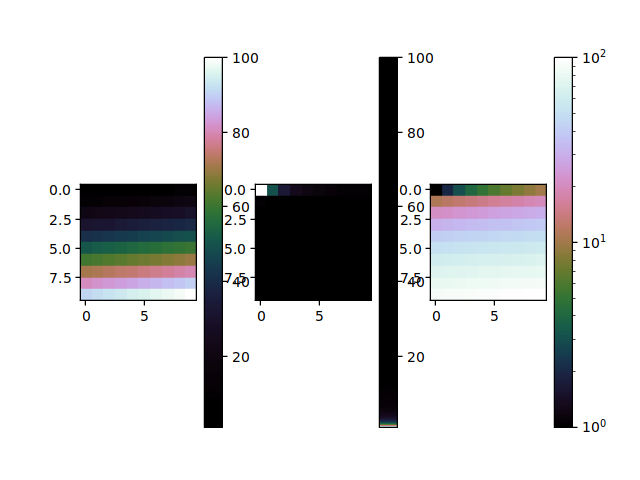
(compare with the PNorm(-2) colorbar which is basically useless (pretend that the values in the image are distributed such that we indeed get colors of each hue...)).
As I already argued elsewhere, there is some machinery associating scales to tickers (
Scale.set_default_locators_and_formatters); it would be nice if norms could reuse that (and then custom norms could need to implement their own set_default_locators_and_formatters, which is fine -- can't guess it).jklymak commentedon Oct 29, 2018
OK, and maybe we also need a
Norm.get_scaleorscale.get_scale_from_normand then the colorbar could use that as the scale rather than guessing the scale. They are such similar concepts that we should be able to make it easier to get from one to the other...anntzer commentedon Oct 29, 2018
See #7294 and #7631 for some long and confused discussion about norms and scales... (I think(?) only one of them should exist: a Norm is nothing else than a Scale on the colorbar axis.)
jklymak commentedon Oct 29, 2018
OK, I always have to refresh myself on all this stuff...
Scalesare wrappers around transforms1. have
set_default_locators_and_formattersmethod to set those2. have
limit_range_for_scaleto clip the data, which I guess transforms don't have.Normalize': 1. has an inverse 2. doesn't useTransforms`3. Does some autoscaling
So, I think i agree that there isn't a huge difference between the two. Not sure what the path forward for homogenizing the two would be, but it seems possible.
jklymak commentedon Nov 15, 2018
#12808 is another example of this functionality being missing.
I'd propose that we get it working for axis objects first, and then worry about colorbars 😉
jklymak commentedon Nov 15, 2018
#11859 (comment) for another comment on this.
github-actions commentedon May 21, 2023
This issue has been marked "inactive" because it has been 365 days since the last comment. If this issue is still present in recent Matplotlib releases, or the feature request is still wanted, please leave a comment and this label will be removed. If there are no updates in another 30 days, this issue will be automatically closed, but you are free to re-open or create a new issue if needed. We value issue reports, and this procedure is meant to help us resurface and prioritize issues that have not been addressed yet, not make them disappear. Thanks for your help!
anntzer commentedon May 21, 2023
This is effectively fixed by make_norm_from_scale, e.g.