Repository navigation
Adding twin axes to an axis with GridHelperCurveLinear (from example) makes some ticklabels disappear #10748
Closed as not planned
Description

Bug report
Bug summary
Adding twin axes to another axis created with gridhelper GridHelperCurveLinear makes some of the ticklabels of the polar grid disappear.
Code for reproduction
Working fine:
import numpy as np
import matplotlib.pyplot as plt
from mpl_toolkits.axisartist import SubplotHost
from mpl_toolkits.axisartist.grid_helper_curvelinear import GridHelperCurveLinear
import mpl_toolkits.axisartist.angle_helper as angle_helper
from matplotlib.projections import PolarAxes
from matplotlib.transforms import Affine2D

class FormatterDMS(object):
    '''Transforms angle ticks to damping ratios'''
    def __call__(self,direction,factor,values):
        angles_deg = values/factor
        damping_ratios = np.cos((180-angles_deg)*np.pi/180)
        ret = ["%.2f"%val for val in damping_ratios]
        return ret

class ModifiedExtremeFinderCycle(angle_helper.ExtremeFinderCycle):
    '''Changed to allow only left hand-side polar grid'''
    def __call__(self, transform_xy, x1, y1, x2, y2):
        x_, y_ = np.linspace(x1, x2, self.nx), np.linspace(y1, y2, self.ny)
        x, y = np.meshgrid(x_, y_)
        lon, lat = transform_xy(np.ravel(x), np.ravel(y))

        with np.errstate(invalid='ignore'):
            if self.lon_cycle is not None:
                lon0 = np.nanmin(lon)
                lon -= 360. * ((lon - lon0) > 360.) # Changed from 180 to 360 to be able to span only 90-270 (left hand side)
            if self.lat_cycle is not None:
                lat0 = np.nanmin(lat)
                lat -= 360. * ((lat - lat0) > 360.) # Changed from 180 to 360 to be able to span only 90-270 (left hand side)

        lon_min, lon_max = np.nanmin(lon), np.nanmax(lon)
        lat_min, lat_max = np.nanmin(lat), np.nanmax(lat)

        lon_min, lon_max, lat_min, lat_max = \
            self._adjust_extremes(lon_min, lon_max, lat_min, lat_max)

        return lon_min, lon_max, lat_min, lat_max

def sgrid():
    # From matplotlib demos:
    # https://matplotlib.org/gallery/axisartist/demo_curvelinear_grid.html
    # https://matplotlib.org/gallery/axisartist/demo_floating_axis.html

    # PolarAxes.PolarTransform takes radian. However, we want our coordinate
    # system in degree
    tr = Affine2D().scale(np.pi/180., 1.) + PolarAxes.PolarTransform()
    # polar projection, which involves cycle, and also has limits in
    # its coordinates, needs a special method to find the extremes
    # (min, max of the coordinate within the view).

    # 20, 20 : number of sampling points along x, y direction
    sampling_points = 20
    extreme_finder = ModifiedExtremeFinderCycle(sampling_points, sampling_points,
                                                lon_cycle=360,
                                                lat_cycle=None,
                                                lon_minmax=(90,270),
                                                lat_minmax=(0, np.inf),)

    grid_locator1 = angle_helper.LocatorDMS(15)
    tick_formatter1 = FormatterDMS()
    grid_helper = GridHelperCurveLinear(tr,
                                        extreme_finder=extreme_finder,
                                        grid_locator1=grid_locator1,
                                        tick_formatter1=tick_formatter1
                                        )

    fig = plt.figure()
    ax = SubplotHost(fig, 1, 1, 1, grid_helper=grid_helper)

    # make ticklabels of right invisible, and top axis visible.
    visible = True
    ax.axis[:].major_ticklabels.set_visible(visible)
    ax.axis[:].major_ticks.set_visible(False)
    ax.axis[:].invert_ticklabel_direction()

    ax.axis["wnxneg"] = axis = ax.new_floating_axis(0, 180)
    axis.set_ticklabel_direction("-")
    axis.label.set_visible(False)

    # let left axis shows ticklabels for 1st coordinate (angle)
    ax.axis["left"].get_helper().nth_coord_ticks = 0
    ax.axis["right"].get_helper().nth_coord_ticks = 0
    ax.axis["left"].get_helper().nth_coord_ticks = 0
    ax.axis["bottom"].get_helper().nth_coord_ticks = 0

    fig.add_subplot(ax)
    ax.grid(True, zorder=0,linestyle='dotted')
    return ax, fig

ax, f = sgrid()
ax.plot([-5,5],[-5,5])
Results in:

Adding this however:
    par2 = ax.twin()
    new_fixed_axis = par2.get_grid_helper().new_fixed_axis
    par2.axis["left"] = new_fixed_axis(loc="left",
                                       axes=par2,
                                       offset=(0, 0))
    par2.axis["bottom"] = new_fixed_axis(loc="bottom",
                                       axes=par2,
                                       offset=(0, 0))
Results in lost ticklabels for the upper part:

Matplotlib version
- Operating system: Windows 10
- Matplotlib version: 2.1.2
- Matplotlib backend (
print(matplotlib.get_backend())): TkAgg - Python version: 3.6.4
Installed from pip.
Activity
kmuehlbauer commentedon Oct 2, 2018
@ImportanceOfBeingErnest Regarding your comment I'm trying to fix some things in
mpl_toolkit.I have found the source of this issue here, at least why the tickmarks etc are gone. The twin()-method makes the "top" and "right" axes invisible. This is actually the same behaviour as in twinx().
What needs decision is the wanted default behaviour. Should all possible axes be displayed by default? Sure the added image is not how we want to have it (all possible axes visible).
@Sup3rGeo Any ideas how this should look like?
So, questions are, where to put the different axes and which should be made invisible. This decision also affects the remove method.
kmuehlbauer commentedon Oct 2, 2018
@smheidrich Sorry for disturbing, I'm trying to understand which axes need to be visible and which not. And for sure, the most logical solution. Looking at the commented code fragments before your changes in d268abf there has been quite some testing to probably find a nice solution. Do you remember why you've prefered this solution?
smheidrich commentedon Oct 2, 2018
@kmuehlbauer The point behind my changes is summarized in the difference between the two images in this comment (which was also put into the tests as
mpl_toolkits.tests.test_axes_grid1.test_twin_axes_empty_and_removed): previously, there was an (in my opinion, anyway) inconsistency betweentwinx/twinyand justtwin, as seen in rows 3-5 of the first picture. My changes were only meant to make it consistent, but if this was a poor choice which messes up some other use cases then it should be either reverted altogether or made consistent in a different way.By the way, there was another issue stemming from my changes that never got fixed, summarized here - but I guess that is a slightly different issue and this here relates to just
twinand notset_visible? Regardless, that was another case where my changes didn't mesh well together with other parts ofmpl_toolkits, because I really only tested the most simple case... very sorry about that. At this point it feels like it makes more sense to just revert my commit altogether (and then revert back associated example code, e.g. #5757 and #6836).ImportanceOfBeingErnest commentedon Oct 2, 2018
I have to say I don't know what the expected outcome of the code here should be. I think the images in the comment in #4898 by @smheidrich are pretty convincing. So in this case I would think that due to the use of the
twinmethod all axes visible is indeed expected? I suppose one can still set them invisible manually in case they are undesired? (If in doubt, I'd say removing something that is present is often easier than getting something to show that isn't.)But my understanding of the axisartist module is pretty limited. That's why it is helpful if people who actually use this module work on fixing it. One main problem is the documentation in my eyes, since it currently does not allow to easily grasp the concepts.
kmuehlbauer commentedon Oct 2, 2018
@smheidrich Thanks for coming back to this, and for the pointers.
I'll have another look into this the next days adding some of my use cases here.
@ImportanceOfBeingErnest I adapted my use case from a matplotlib example. I'm not sure, if I used the API correctly but we will find out.
Thanks for responding, all.
smheidrich commentedon Oct 2, 2018
It would still be consistent if
twin*were changed to behave liketwinx/twinydid prior to d268abf, i.e. if it added just the ticks and ticklabels, while keeping the axis line of the host. That would solve this issue, wouldn't it? Row 3 of the mentioned test comparison image would have to be updated, of course.Are the plots which are generated for the gallery and docs part of CI by now, with image comparison tests? That would come in handy when changing anything in
mpl_toolkits.ImportanceOfBeingErnest commentedon Oct 3, 2018
The documentation is tested in the sense that it generates successfully. If an example from the gallery was to error out, the test would fail. However there is no image comparisson. If an example simply produces some wrong image this is not caught. Of course one could simply copy the code from any example and create a test from it. In general, the number of image comparissons should not grow too large, and sometimes it would be enough to test for certain things like visibility or positions. Possibly, several examples can also be combined into a single image comparisson.
smheidrich commentedon Oct 3, 2018
I see, thanks!
kmuehlbauer commentedon Oct 3, 2018
This is a stripped down version of my use case:
Retested with d5a4eda, updated code
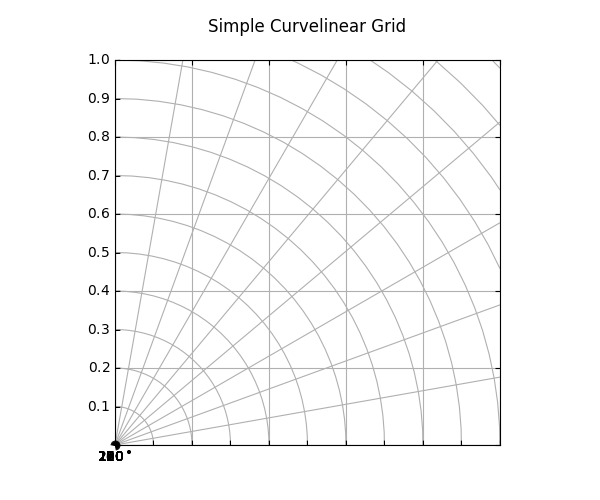
kmuehlbauer commentedon Oct 3, 2018
Status Quo, created with d5a4eda
kmuehlbauer commentedon Oct 3, 2018
Wanted, created with d5a4eda
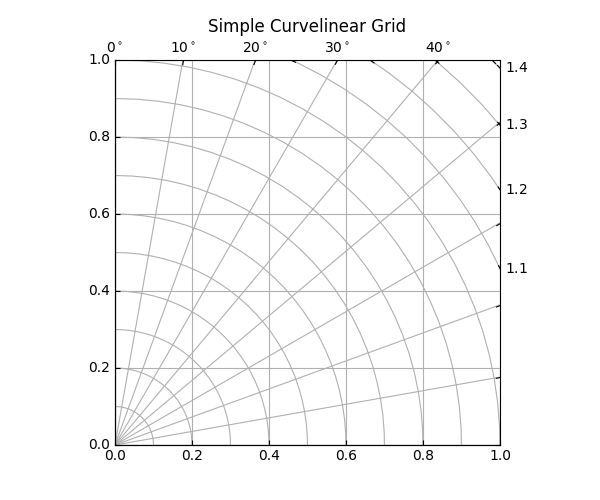
kmuehlbauer commentedon Oct 3, 2018
Just remove the comments below the line containing
# make everything look rightto get the wanted output.kmuehlbauer commentedon Oct 3, 2018
The current behaviour makes
topandrightofcgaxinvisible, remainingleftandbottom.ButTo make everything look nice, I had to makecgax.twin()is adding toleftandbottomtoo, which leads to this overplotting.topandrightofcgaxvisible again as well as the ticklabels. Also had to makeleftandbottomofcaaxvisible andtopandrightinvisible.This is all true for the current configuration (xlim/ylim: 0,1). But think of (xlim/ylim: -1,0), Then the different axes need to be on the opposite of each other (at least the axes with the angles, see image below, created with d5a4eda) .
So, currently I'm a bit at loss, if there is single fitting solution at all.

kmuehlbauer commentedon Oct 3, 2018
Should it be that easy now? OK, in
twin()-method the following is done:So the
topandrightof the twin-axes are setvisible. But this does not activate the ticks etc.So if I take my example from above and just do:
then I get an image with all wanted axes (see below, created with d5a4eda). We see that the placement of the
bottomaxes is not good. But we can't do much about it. Now the user has to switch axes to his liking.2 remaining items
Sup3rGeo commentedon Oct 3, 2018
I am actually quite beginner with matplotlib and it has been a while since I opened this one, so I am not totally sharp.
But I think I agree with @ImportanceOfBeingErnest:
In general I would not expect anything on the host axis to be hidden when adding a twin, it was a bit confusing. Then when adjusting the axis, if there is no one-size-fits-all, the possibilities should be at least well documented.
kmuehlbauer commentedon Oct 4, 2018
@Sup3rGeo Thanks for responding. I would also agree, that it's a bit confusing if parts of the original host axis are silently hidden. I searched the current examples/demos but couldn't find anything related to this specific behaviour. Why not add nice example showing how to handle this specific use case?
Also the twin()-function docstring needs an update, it is the same as twinx() currently.
Other opinions?
smheidrich commentedon Oct 5, 2018
Just so I understand: Does the issue of "angle" ticklabels being drawn on top of each other in the bottom left corner of #10748 (comment) have anything to do with this
twinissue? At least in my testing, this happens even if I remove thetwincall altogether, but I don't really get what's going on there anyway.If it is a separate issue, the only issue here is that nothing on the host axes should be hidden when using any of the
twin*methods, right? I think I'd agree that this would be better default behavior. It would also simplify the_remove_methods to just calls ofself.parasites.remove(h).As I wrote in #10748 (comment), this basically means changing
twin*to behave liketwinx/twinydid before d268abf, i.e. you'd callax["right"].line.set_visible(False)intwinxto hide the parasite axis lines instead of the ones of the host, and analogously fortwinyandtwin. In contrast to pre- d268abf behavior, it would still be consistent between all thetwin*methods.I also agree that the
twindocstring should definitely be fixed - that seems like a fairly uncontroversial change :)kmuehlbauer commentedon Oct 7, 2018
@smheidrich Correct, this particular problem has nothing to do with this issue, hence I wrote "But we can't do much about it."
This sounds reasonable to me. It does not hide anything on the host axes and simplifies code.
For sure! 😁
smheidrich commentedon Oct 8, 2018
All right then, should I submit a PR or is anyone else already working on it? Or is there something else to discuss first?
axes_grid1: make twin* not modify host axes
axes_grid1: make twin* not modify host axes
axes_grid1: make twin* not modify host axes
axes_grid1: make twin* not modify host axes
axes_grid1: make twin* not modify host axes
axes_grid1: make twin* not modify host axes
github-actions commentedon May 2, 2023
This issue has been marked "inactive" because it has been 365 days since the last comment. If this issue is still present in recent Matplotlib releases, or the feature request is still wanted, please leave a comment and this label will be removed. If there are no updates in another 30 days, this issue will be automatically closed, but you are free to re-open or create a new issue if needed. We value issue reports, and this procedure is meant to help us resurface and prioritize issues that have not been addressed yet, not make them disappear. Thanks for your help!