-
Notifications
You must be signed in to change notification settings - Fork 1.2k
fixes #1524 #1525
New issue
Have a question about this project? Sign up for a free GitHub account to open an issue and contact its maintainers and the community.
By clicking “Sign up for GitHub”, you agree to our terms of service and privacy statement. We’ll occasionally send you account related emails.
Already on GitHub? Sign in to your account
fixes #1524 #1525
Conversation
|
Do you have a use case where you want to create 5000 errors and you have noticed an actual slow down because of the O(n) error lookup These types of micro benchmarks have a history of not paying off in practice. |
|
The amount of throuput we do, we've run into this issue numerous times, and it effects us hitting our SLA. So yes, this has had a significant impact on performance. In an ideal world, there wouldn't be so many errors, but they are out of our control. |
|
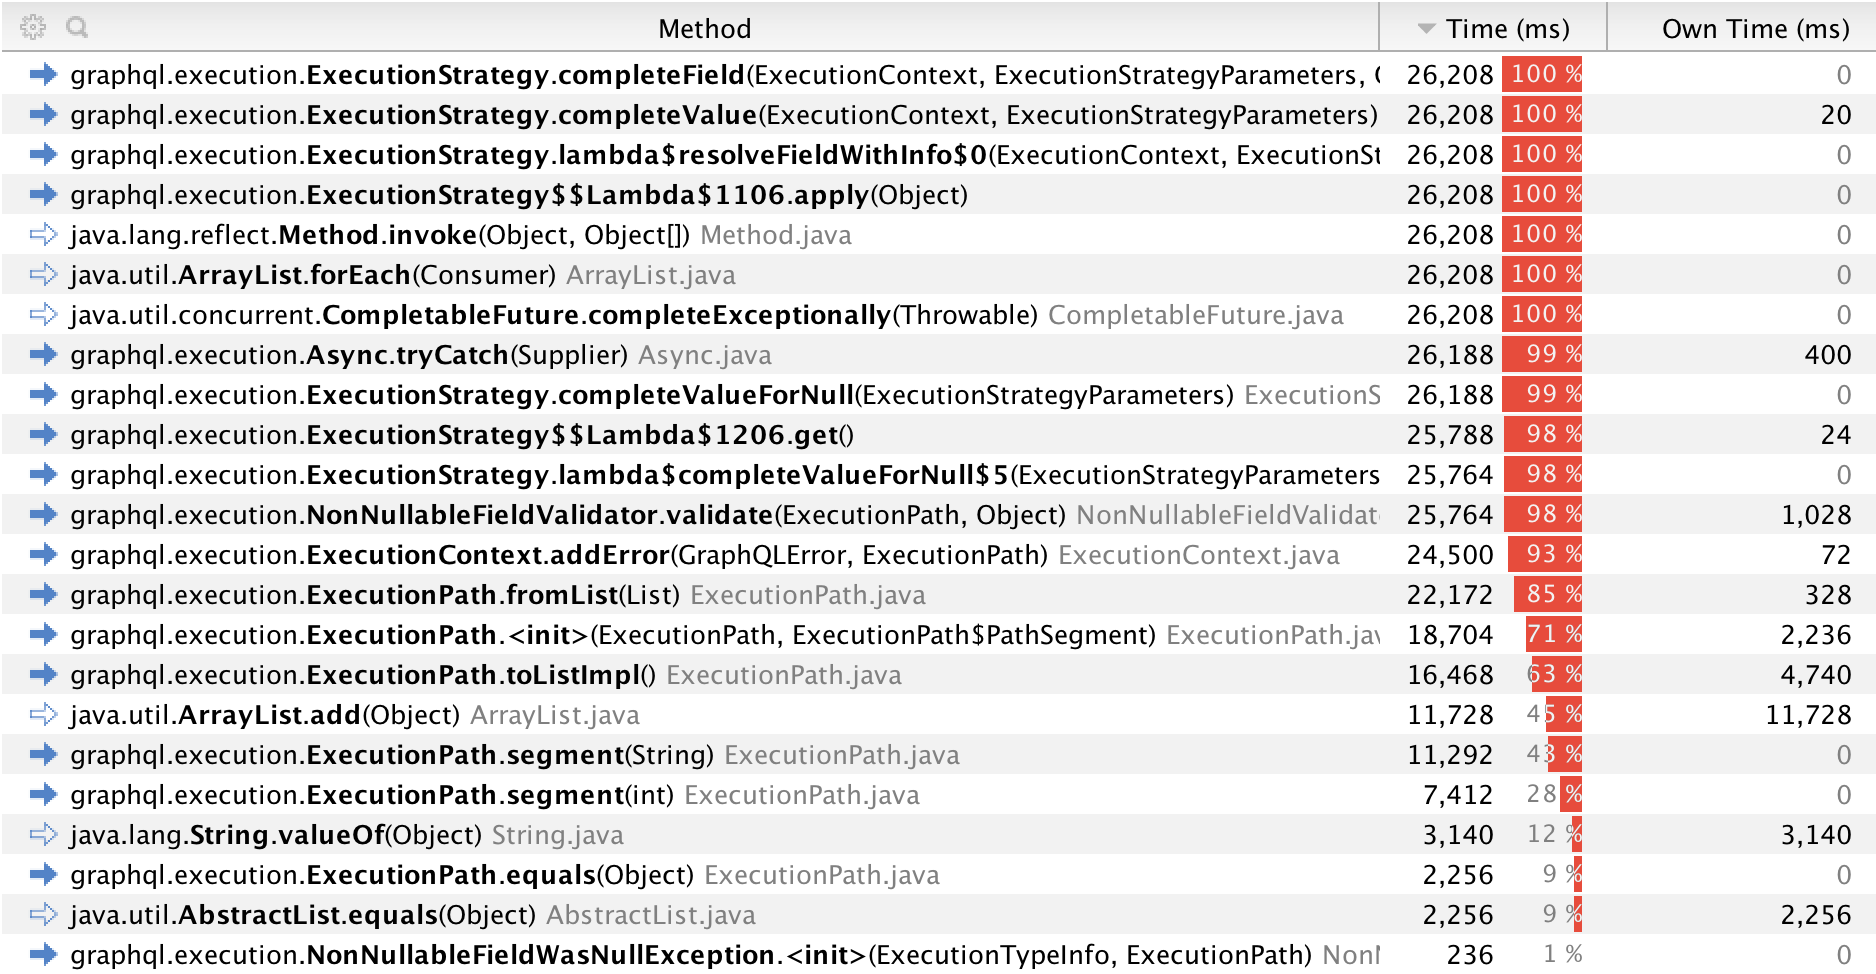
Hi @bbakerman, thanks for looking at this. I was working with @wasche on this and at the time I had hooked up VisualVM to get some CPU profiles. The way I ran this test was to throw a bunch of queries at our GraphQL service. Each query fetched a few hundred items from one service, and then went to a few supplementary services to fill in the fields for those items. I took one of those supplementary services offline to see how the system responded. The issue we were seeing is that if one of those services went down, GraphQL's CPU usage would spike and the service would be severely degraded. Sadly I don't have the full results anymore but I do have this screenshot (below) showing that within my test, of all the time used by I had added a workaround in our service when we were running 9.2, but now that we're upgrading to 12.0, our workaround no longer works (we were relying on the public constructor of |
|
Ok thanks for the evidence... We will merge
…On Wed, May 8, 2019, 12:26 AM Sam Kline ***@***.***> wrote:
Hi @bbakerman <https://github.com/bbakerman>, thanks for looking at this.
I was working with @wasche <https://github.com/wasche> on this and at the
time I had hooked up VisualVM to get some CPU profiles. The way I ran this
test was to throw a bunch of queries at our GraphQL service. Each query
fetched a few hundred items from one service, and then went to a few
supplementary services to fill in the fields for those items. I took one of
those supplementary services offline to see how the system responded.
Sadly I don't have the full results anymore but I do have this screenshot
(below) showing that within my test, of all the time used by
ExecutionStrategy.completeField, 93% of it was spent in
ExecutionContext.addError. I had added a workaround in our service when
we were running 9.2, but now that we're upgrading to 12.0, our workaround
no longer works (we were relying on the public constructor of
ExecutionContext to subclass it and override the addError behavior).
[image: Screen Shot 2018-12-05 at 7 22 36 AM]
<https://user-images.githubusercontent.com/1139644/57307377-71f6cc80-70b2-11e9-9480-db0498f8581d.png>
—
You are receiving this because you were mentioned.
Reply to this email directly, view it on GitHub
<#1525 (comment)>,
or mute the thread
<https://github.com/notifications/unsubscribe-auth/AAMVWSMH4KQ5GI4NRF2ZAE3PUGGSHANCNFSM4HLCPDVQ>
.
|
* fixes graphql-java#1524

* fixes graphql-java#1524

before:
AddError.benchMarkAddError ss 5 1.079 ± 0.064 s/op
after:
AddError.benchMarkAddError ss 5 0.131 ± 0.059 s/op