Releasing the Debugger to MC is the process of landing a new version of the Debugger in MC. It is basically automating the steps :)
- create a new up to date branch in MC and Github
- create the bundle and commit the
assets-manifestin GH and commit the bundle patch in MC. - check for changes in MC since the last bundle. If there have been any other changes, notify the user.
- run the tests in MC, if they pass: create a new Bugzilla bug and append a patch and try run
- if the tests fail or the patch is bad for any reason, automate the steps for updating the bug.
The automation steps are managed in the ship2gecko repo.
Bundle generally speaking is the process of moving the code in github into MC. It literally refers to webpack making a JS and CSS bundle for the Debugger and a JS bundle for each of the workers. But, there are some other steps that are needed in order to get the Debugger code into MC:
- copy the debugger files: e.g. properties, prefs', index.html, panel, moz.build
- copy assets like SVGs
- copy mochitests
Here is the bundle script.
The simplest way to see the size of the bundle, and which packages are taking up space is to look at the webpack visualizer.
vis=true node bin/copy-assets.js --mc ../gecko --assetscd ../gecko/devtools/client/debugger/newopen webpack-stats.html
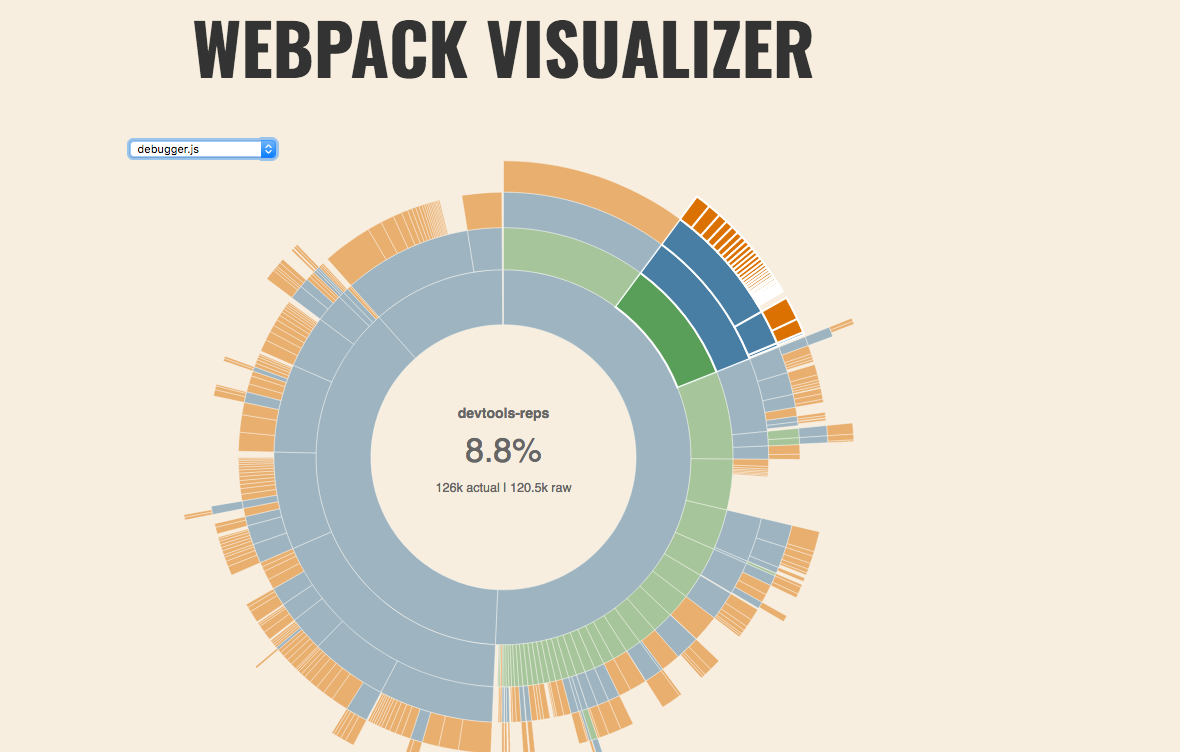
When you see that a package is included that you feel should not be in the bundle, you can open the WebPack Analyzer and look.
- go to analyzer
- select open find the latest stats.json output
<debugger.html>/webpack-stats/stats-<sha>.json
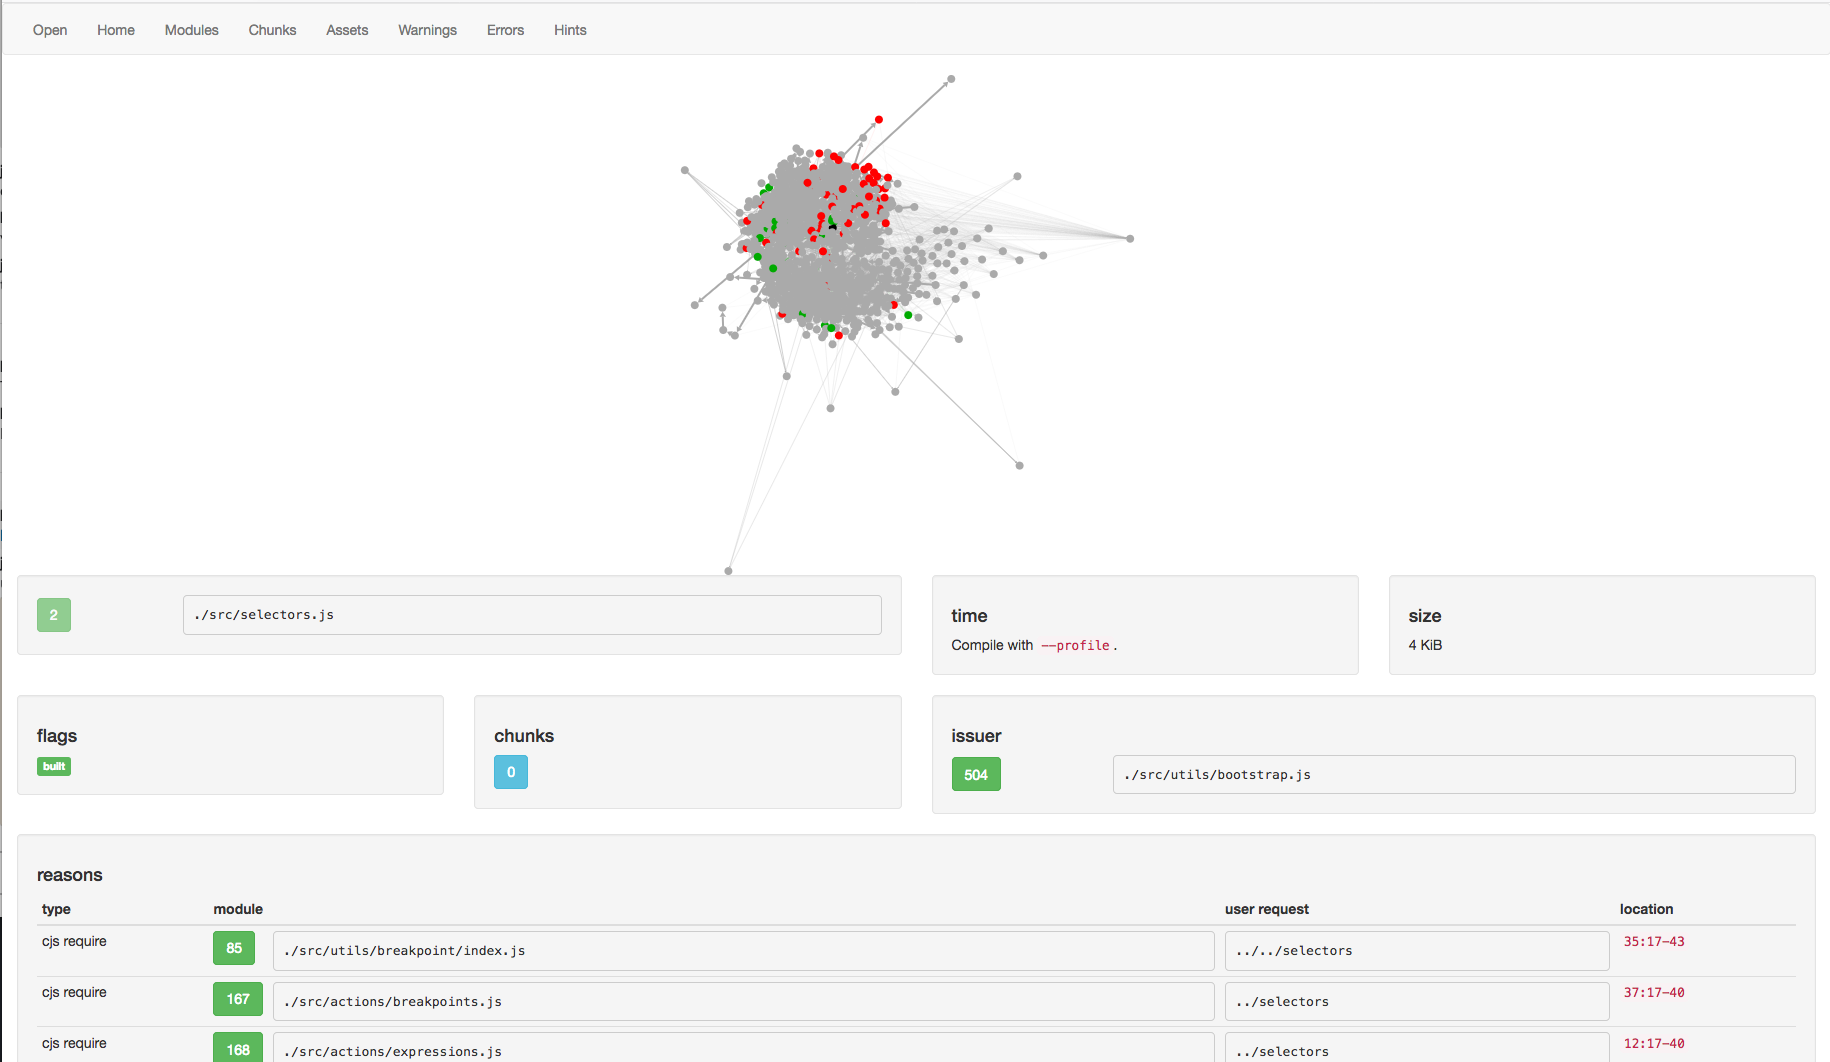
The analyzer is a bit complicated, so here are some things to look for:
- assets/chunks - what chunk number is each asset. The
debuggeris often chunk0 - modules - Which modules appear. Which modules are the largest. Note, you are often looking at just the modules for chunk 0
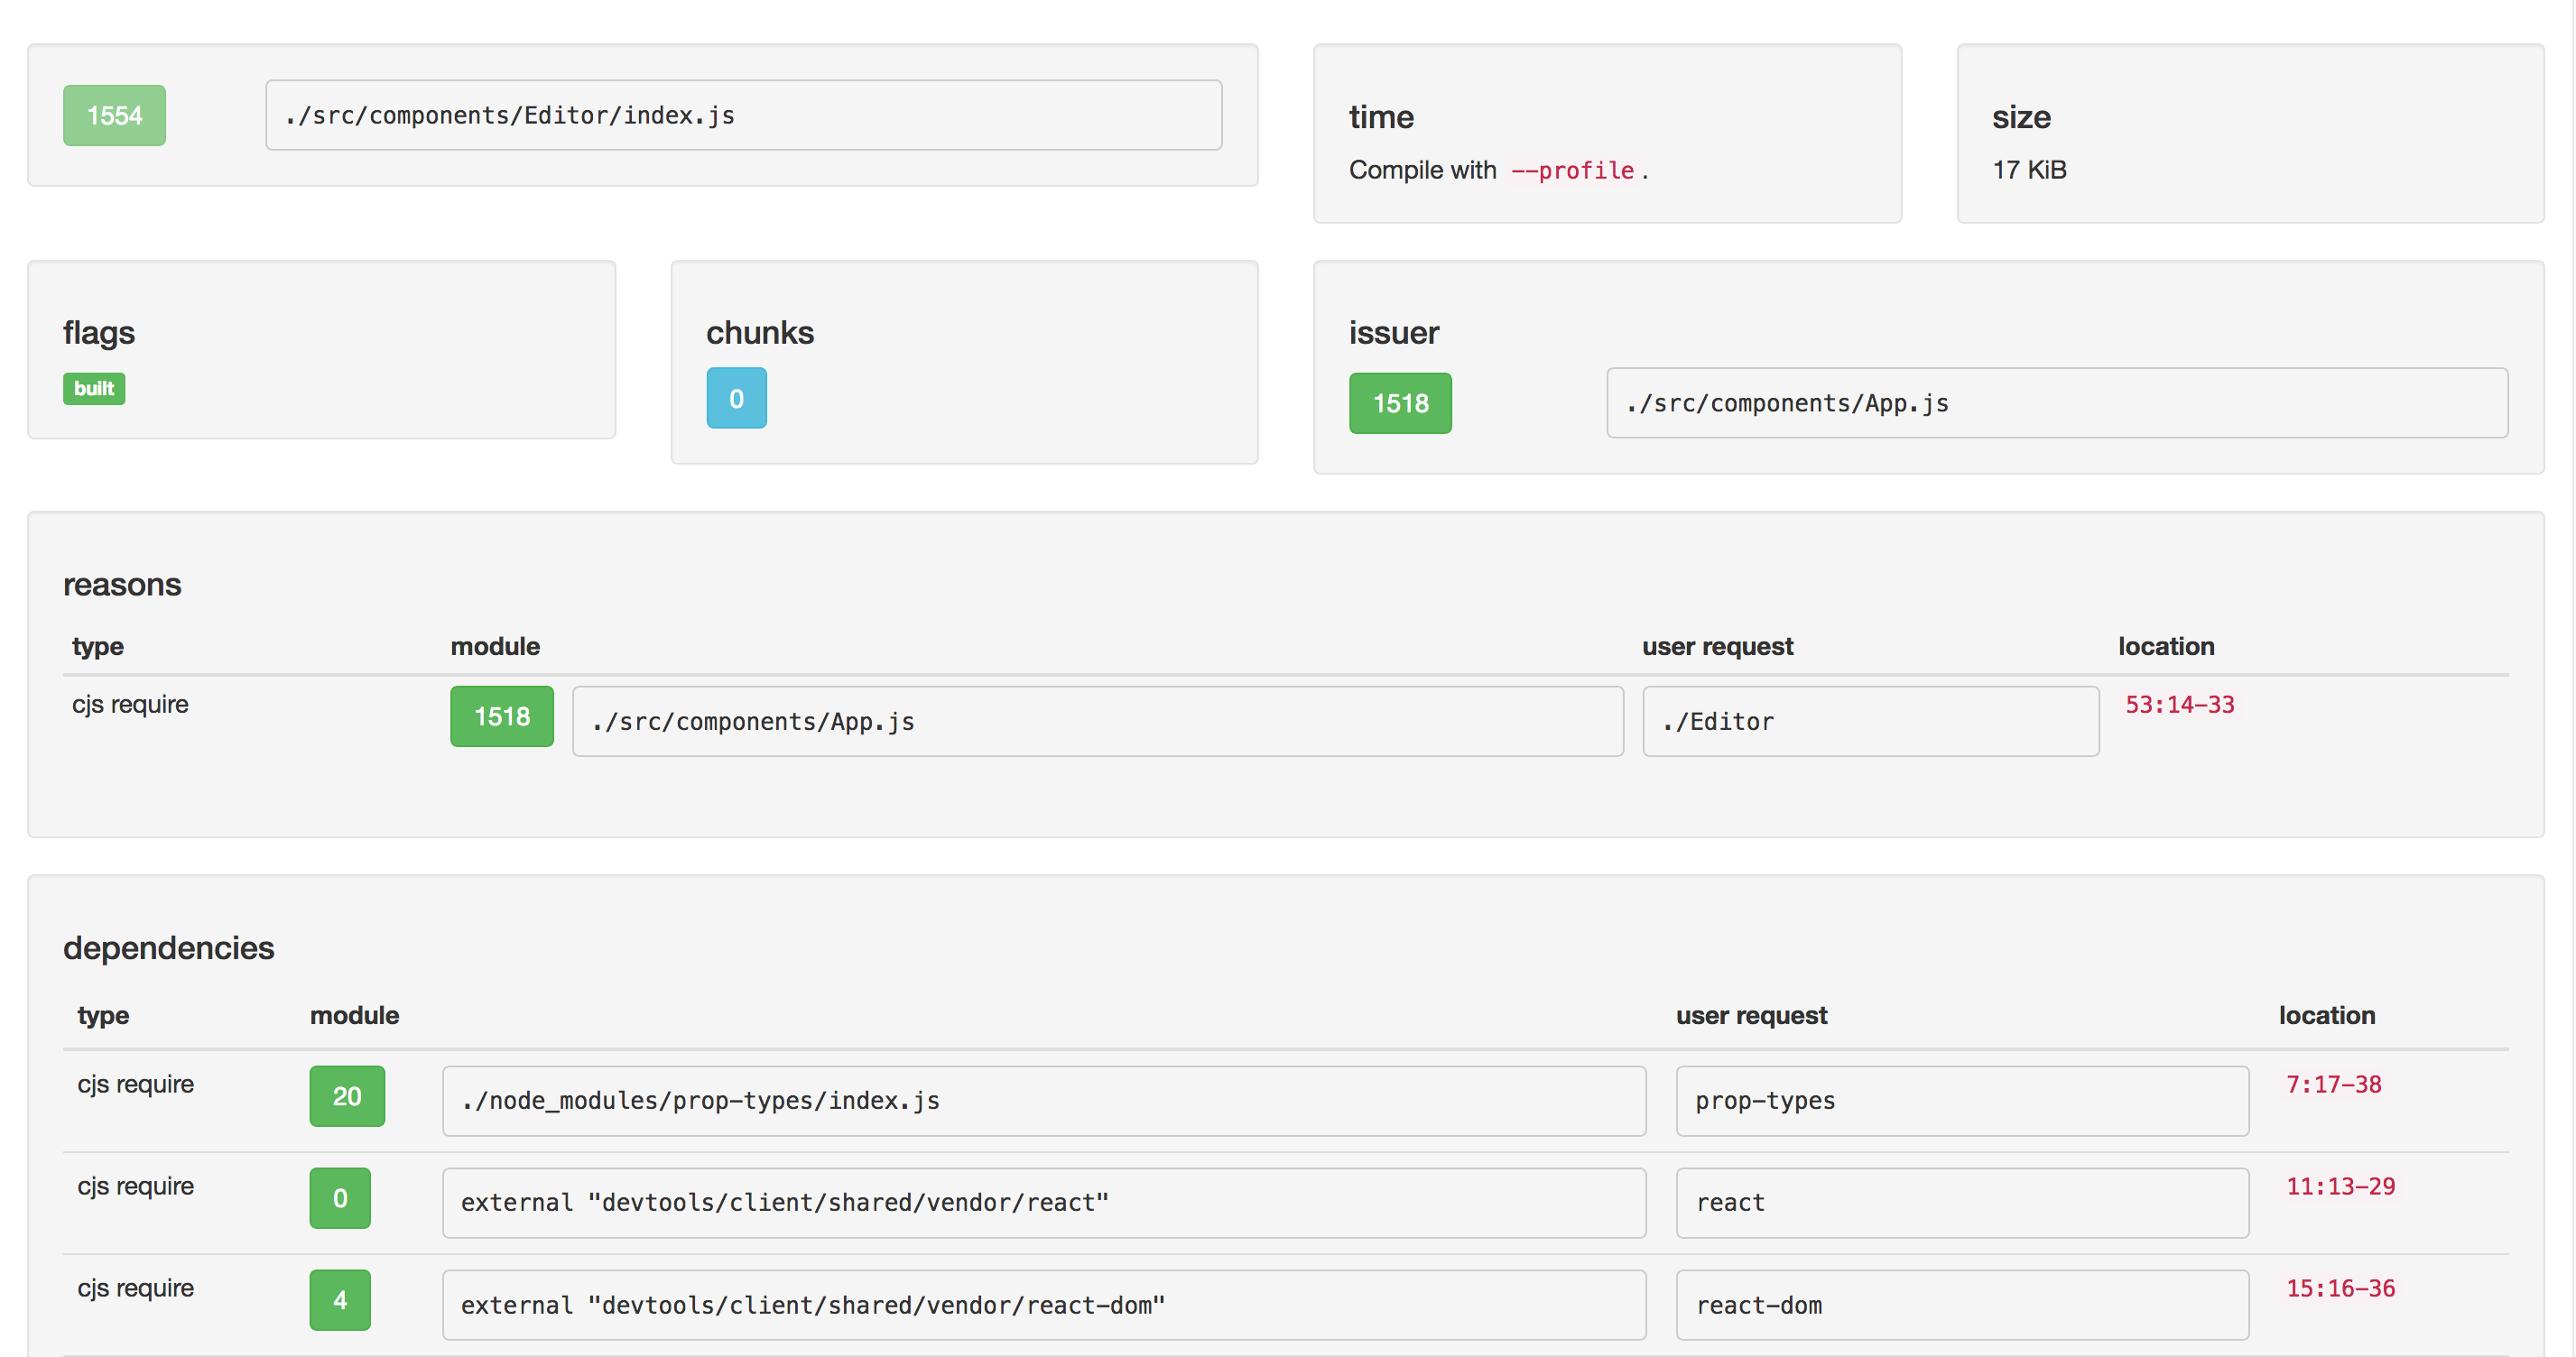
- module - What are the reasons the module was imported. What are the dependencies of the module. It is often useful to start at a large module, see who imported it, until you find the user code.
Notes:
- When modules like
reactare excluded, they show up asexternal ...with a small byte size user-requestis a good way to see what the first request was. For instanceprop-typesresulted in./node_modules/prop-types/index.js