Releasing the Debugger to MC is the process of landing a new version of the Debugger in MC. It is basically automating the steps :)
- checkout the latest release branch
- create a new branch off of it and cherry-pick new commits from master
- go to firefox repo and create a new branch off of mozilla/central
- create a new bug in the debugger component for the release
- run
yarn copy --mc <path to firefox>to copy the files and assets to mc - go to firefox and commit the changes with the title
Bug <ID> - Update Debugger Frontend v<relaease #> r=<reviewer> - go back to the debugger and commit the
assets-manifestand push the branchg push --set-upstream origin -f --no-verify release-<Release Number>
When we notice that a release caused a performance regression in talos, it is important to be able to identify the specific commit(s) that caused the regression. The easiest way to do so is to use try + talos to bisect the commits in the release and find the regression.
- create a spreadsheet with the commits in the release e.g. release 91
- go to the spreadsheet and identify commits that are possible performance regressions
- checkout the release commit in firefox and trigger a try run
./mach try -b o -p linux64,win64 -u none -t damp-e10s --rebuild-talos 6 - checkout the prior release commit in firefox and trigger a try run so there is a baseline for comparison
- choose a couple of commits in the release then bisect the release so that when you have talos results you'll have a better idea of when the problem was introduced.
- for each candidate commit
- checkout the commit in github
- run
yarn copy --mc <path to firefox> - firefox commit the changes
- run
trywith talos./mach try -b o -p linux64,win64 -u none -t damp-e10s --rebuild-talos 6 - add the try url to the sheet in a separate column
- when the try runs are complete
- go to try chooser and select a base and new revision. The revision is in the try URLs you saved in the sheet. NOTE:
the project should be
tryand you'll need to select compare specific revision. - click compare, select the platform you want to compare, and the view the the improvements and regressions for each test.
- go to try chooser and select a base and new revision. The revision is in the try URLs you saved in the sheet. NOTE:
the project should be
Note: A handy way to get the commit listing text to copy into the spreadsheet:
$$('.commit').map(e => [
    e.querySelector('.commit-message').innerText,
    e.querySelector('.commit-id').href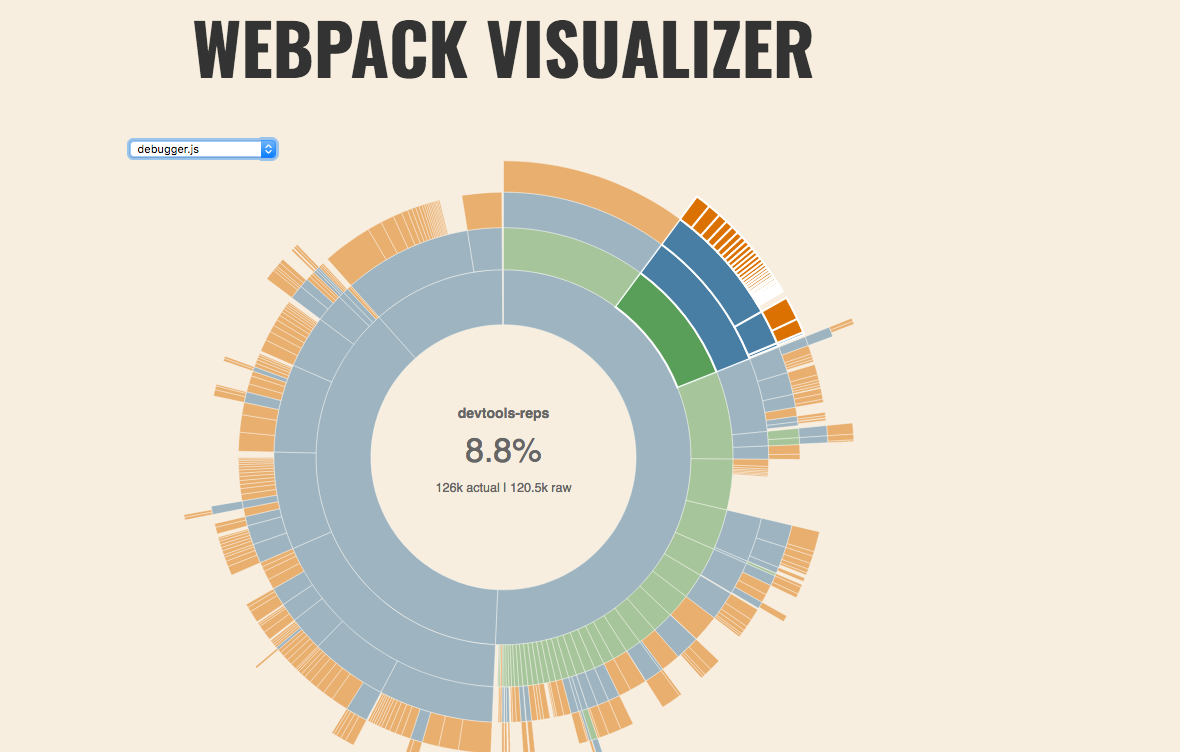
]).map(r => r.join('\t'))The simplest way to see the size of the bundle, and which packages are taking up space is to look at the webpack visualizer.
vis=true node bin/copy-assets.js --mc ../gecko --assetscd ../gecko/devtools/client/debuggeropen webpack-stats.html
When you see that a package is included that you feel should not be in the bundle, you can open the WebPack Analyzer and look.
- go to analyzer
- select open find the latest stats.json output
<debugger>/webpack-stats/stats-<sha>.json
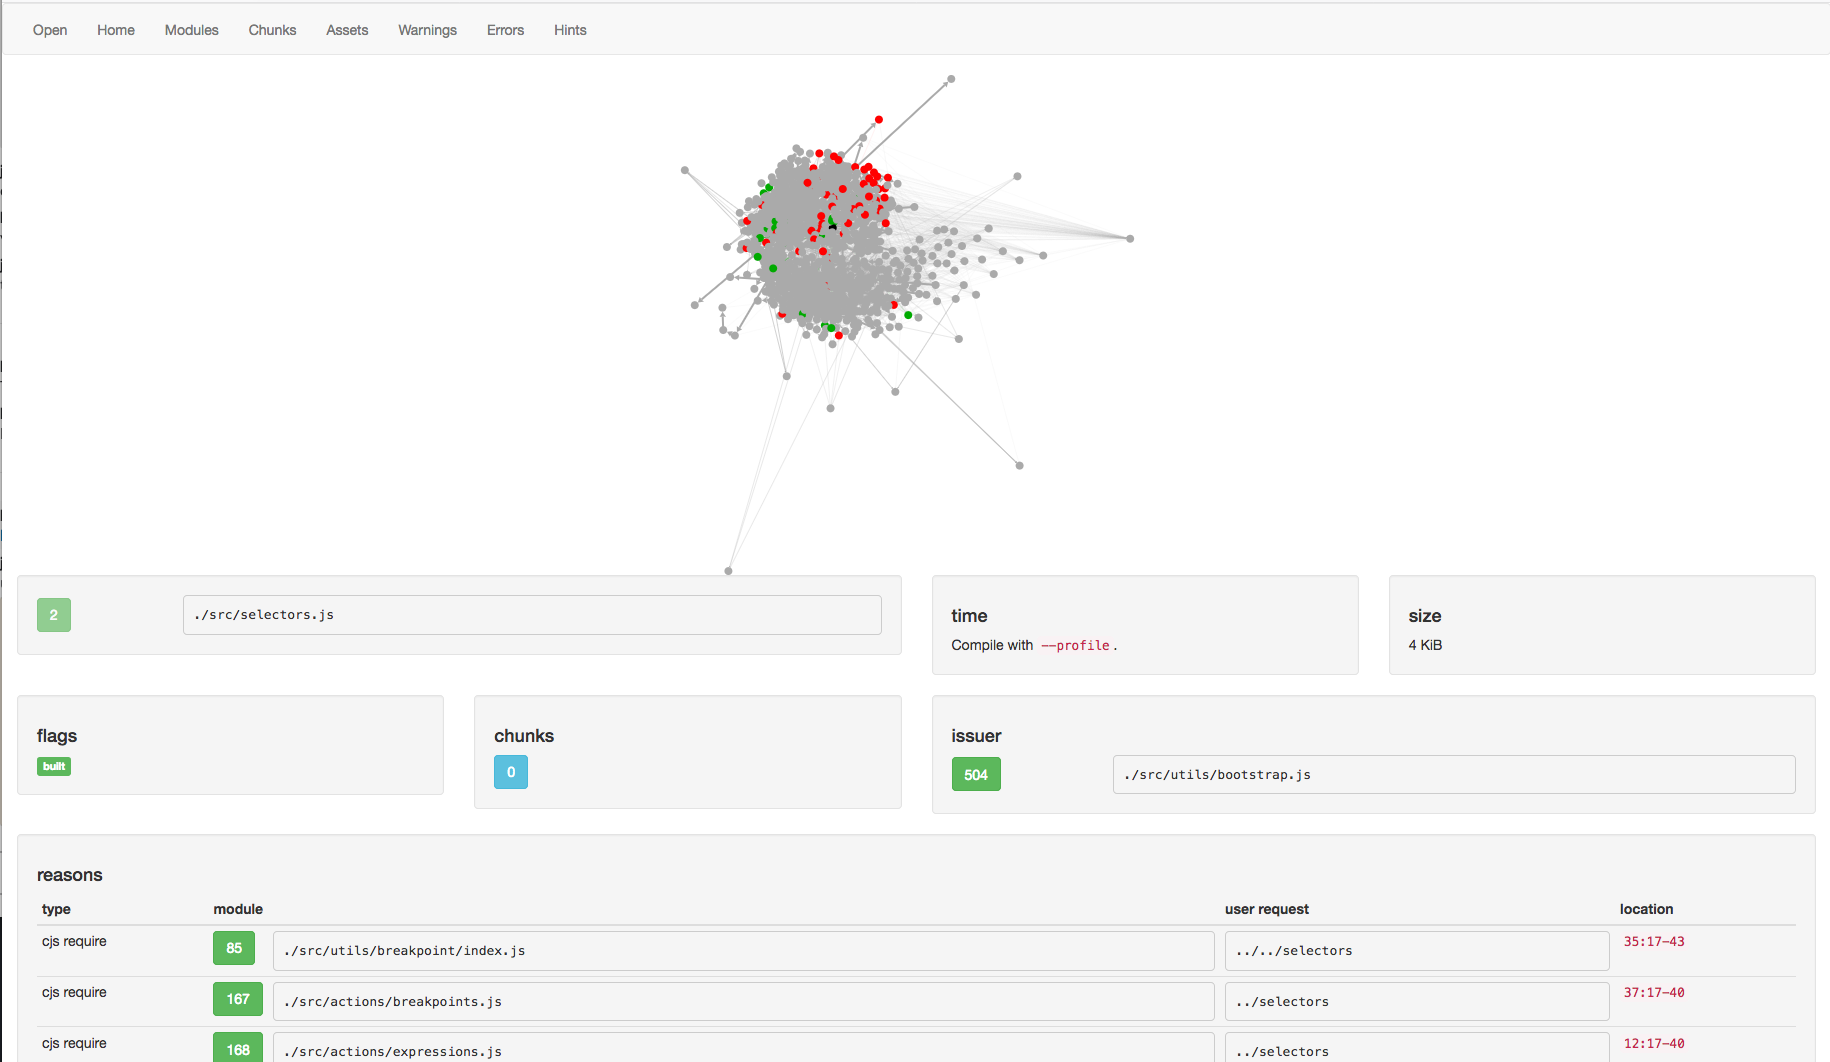
The analyzer is a bit complicated, so here are some things to look for:
- assets/chunks - what chunk number is each asset. The
debuggeris often chunk0 - modules - Which modules appear. Which modules are the largest. Note, you are often looking at just the modules for chunk 0
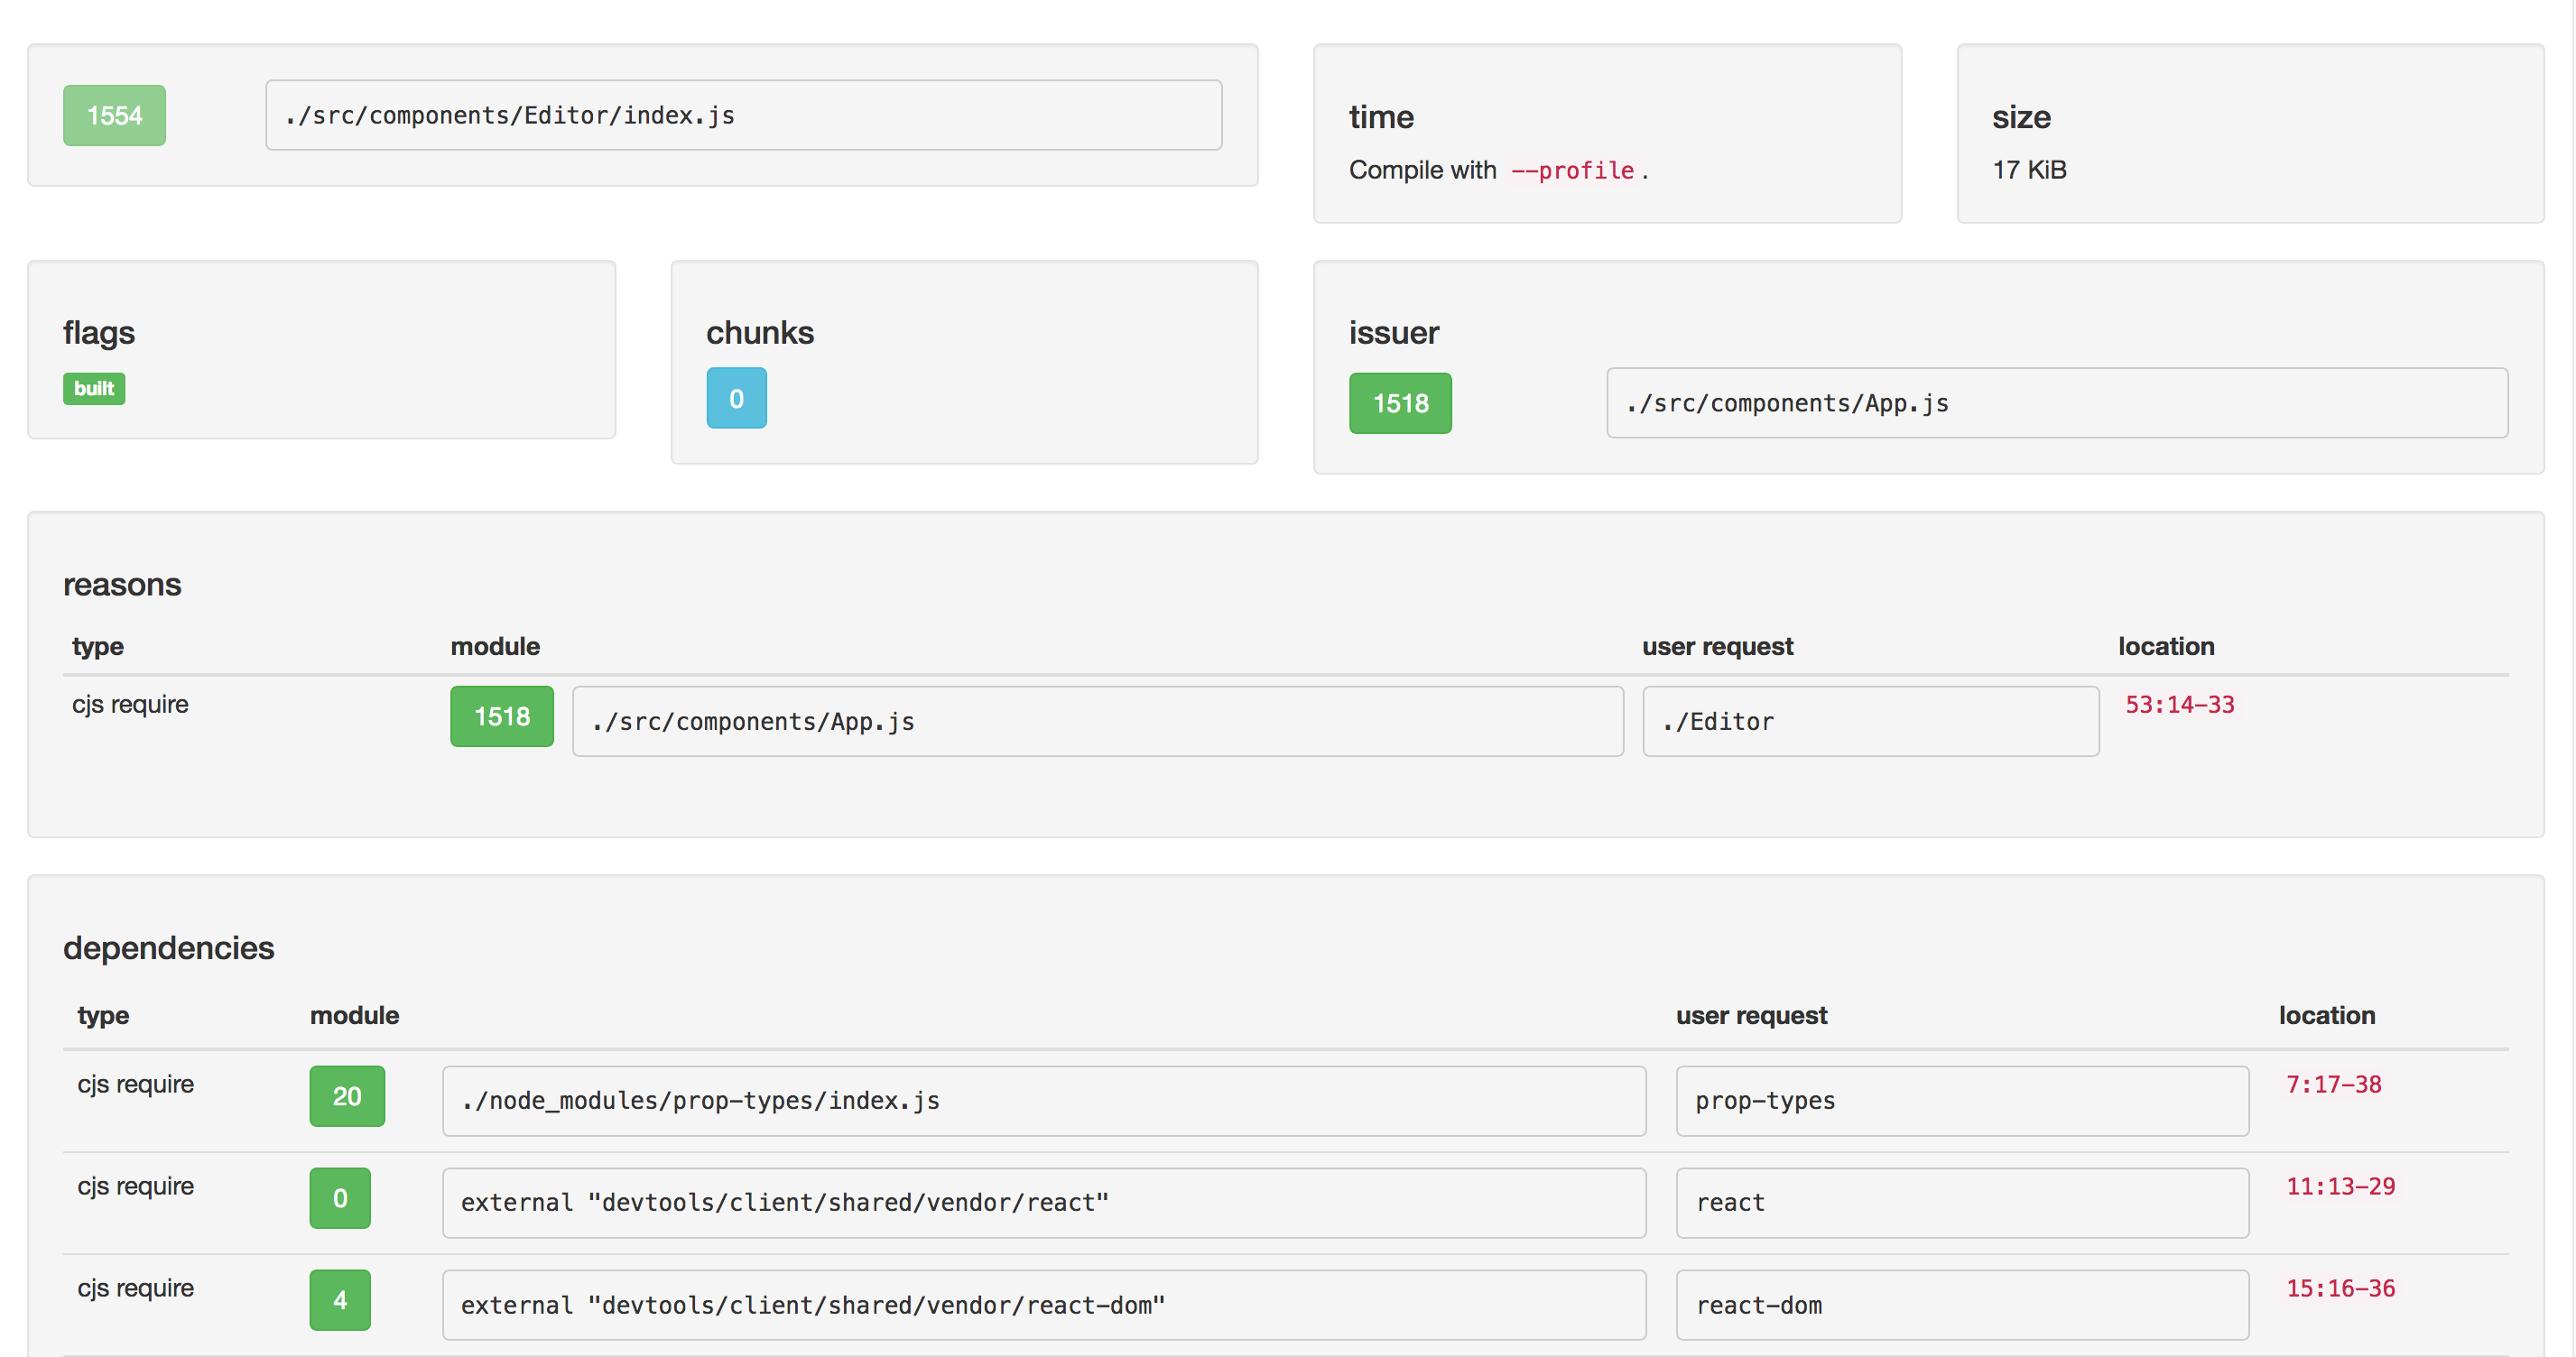
- module - What are the reasons the module was imported. What are the dependencies of the module. It is often useful to start at a large module, see who imported it, until you find the user code.
Notes:
- When modules like
reactare excluded, they show up asexternal ...with a small byte size user-requestis a good way to see what the first request was. For instanceprop-typesresulted in./node_modules/prop-types/index.js