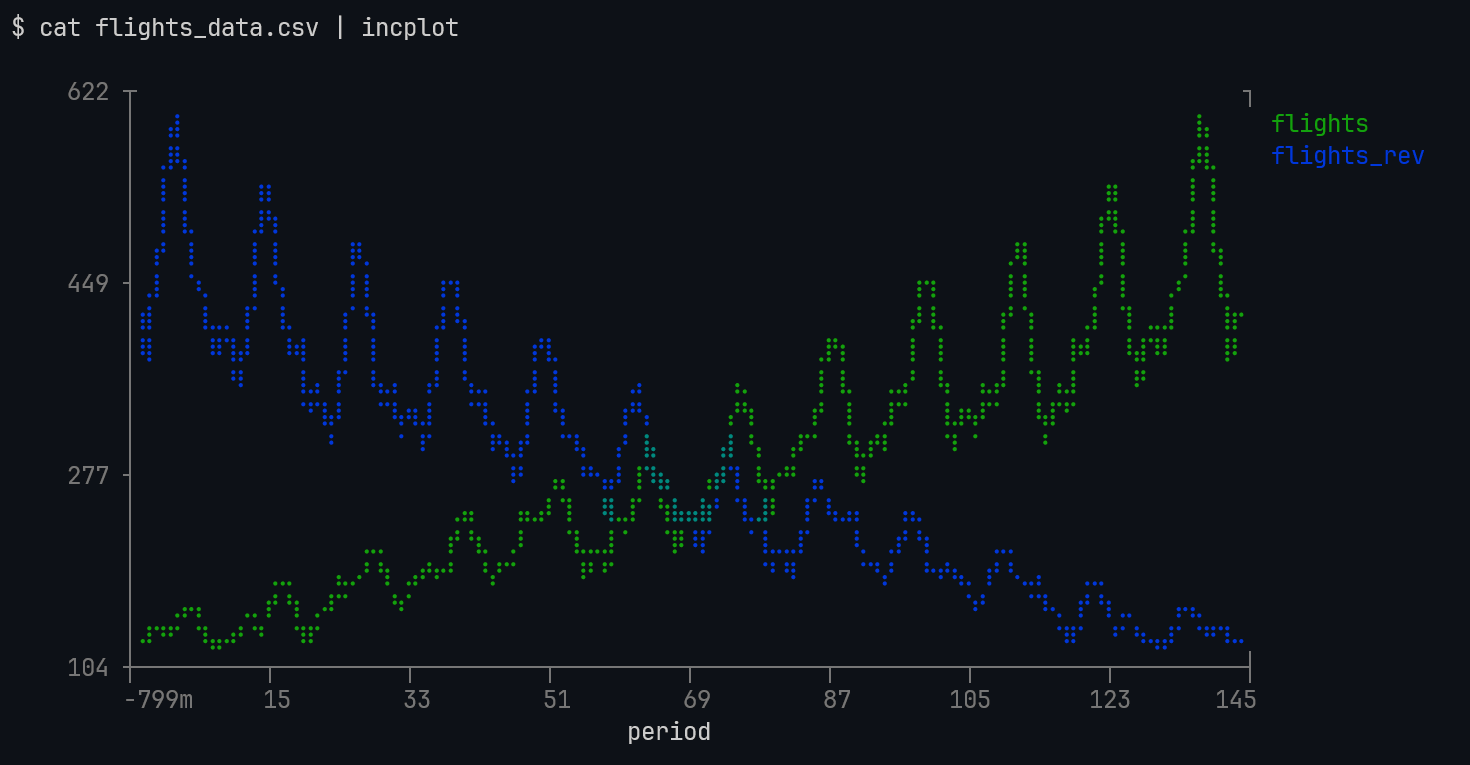
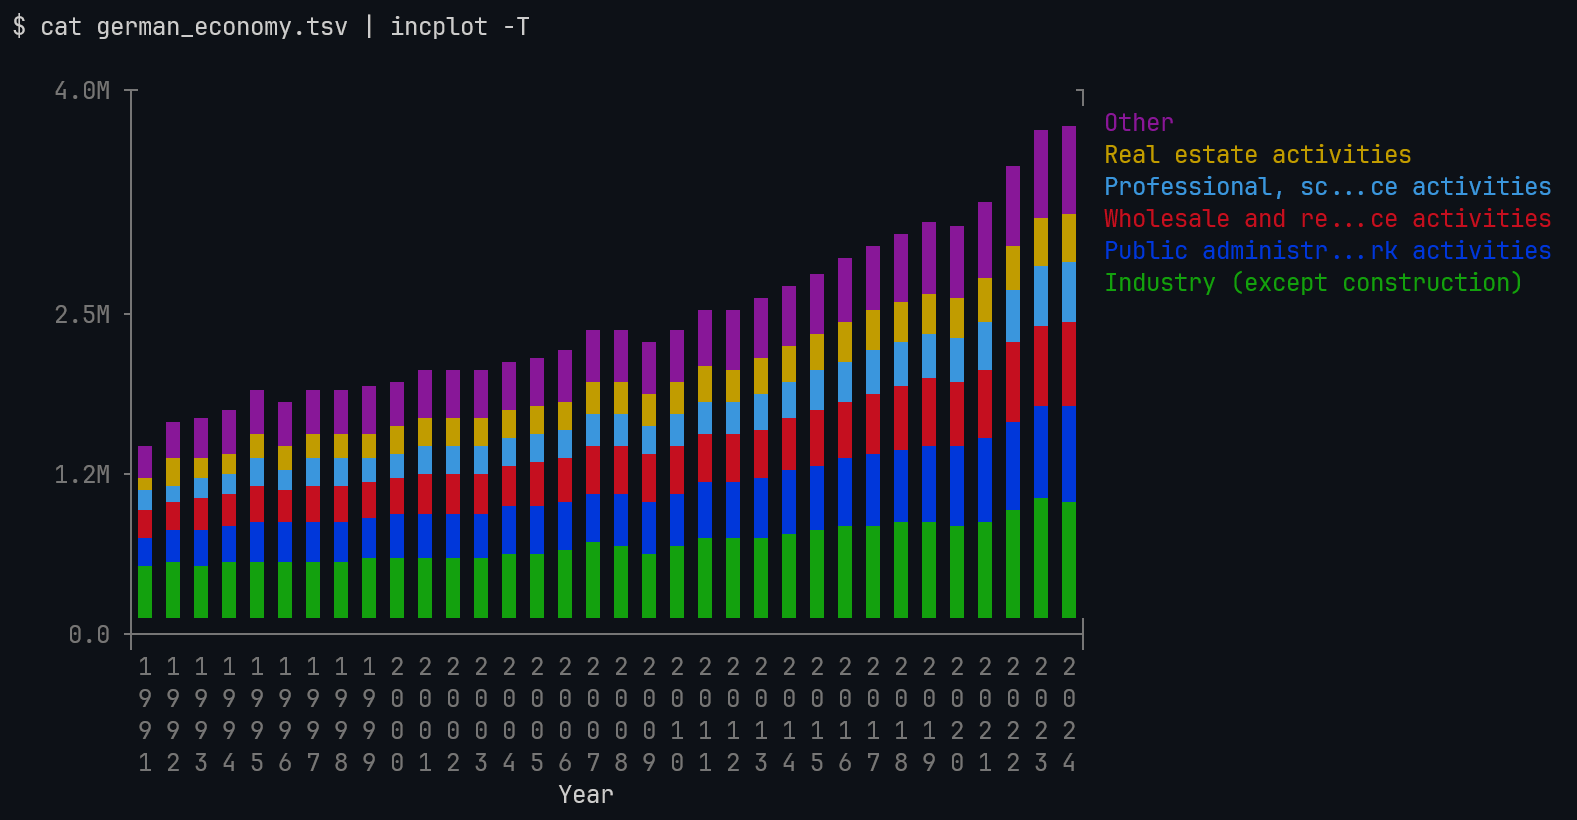
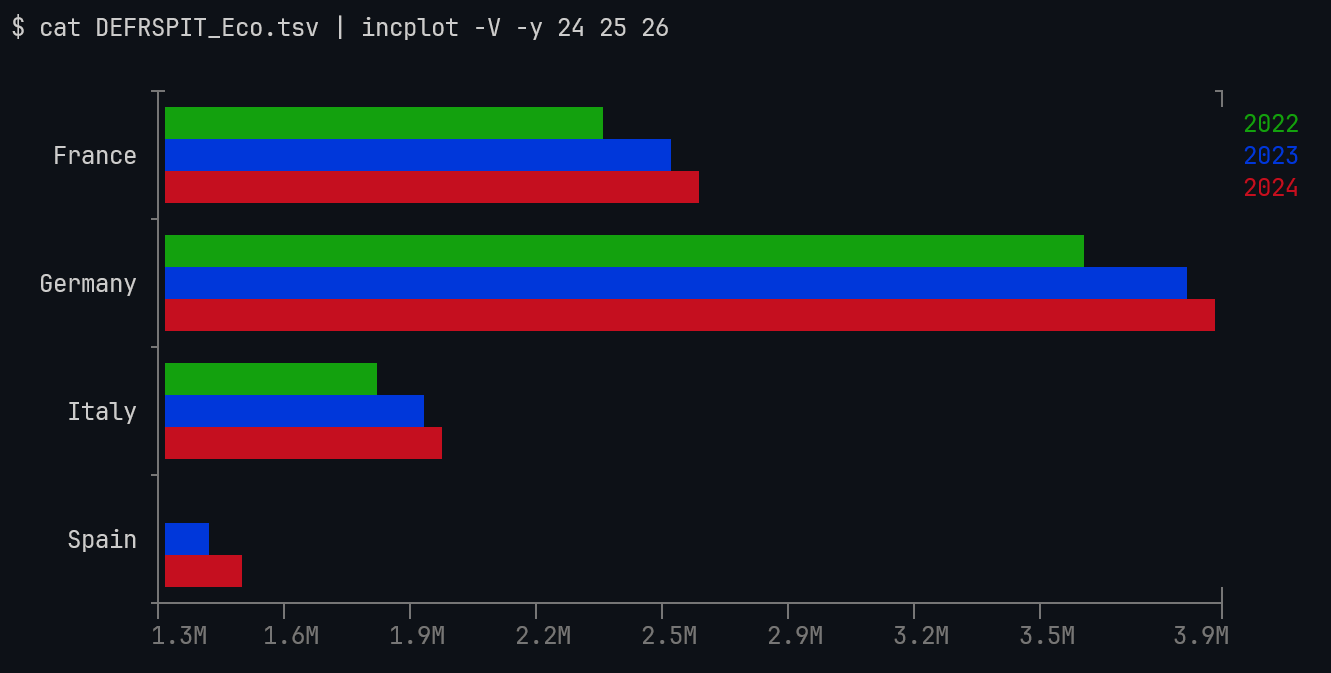
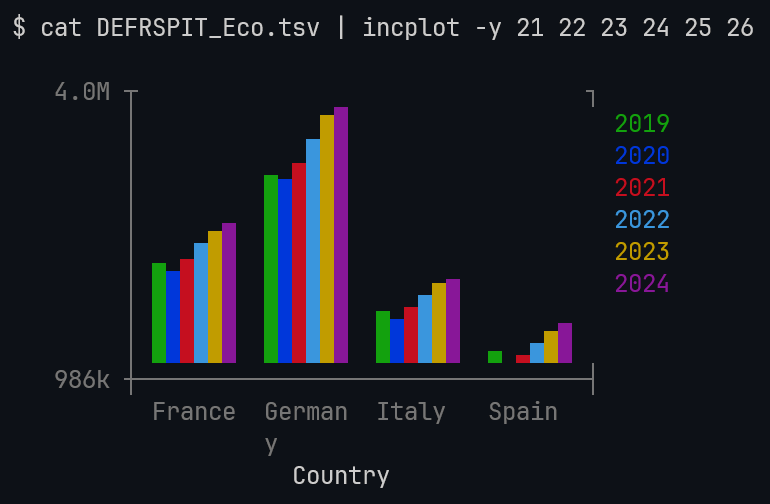
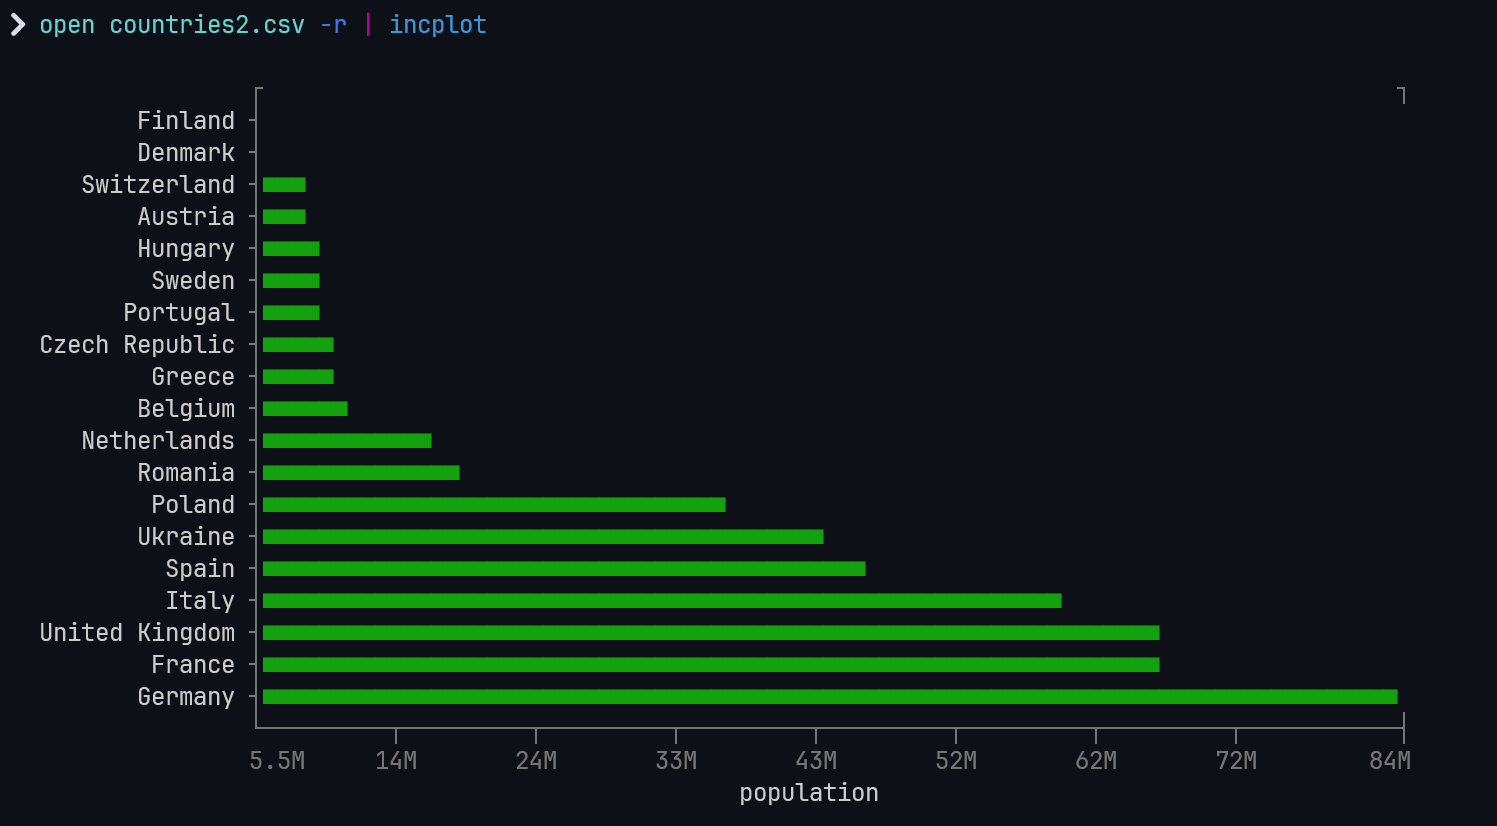
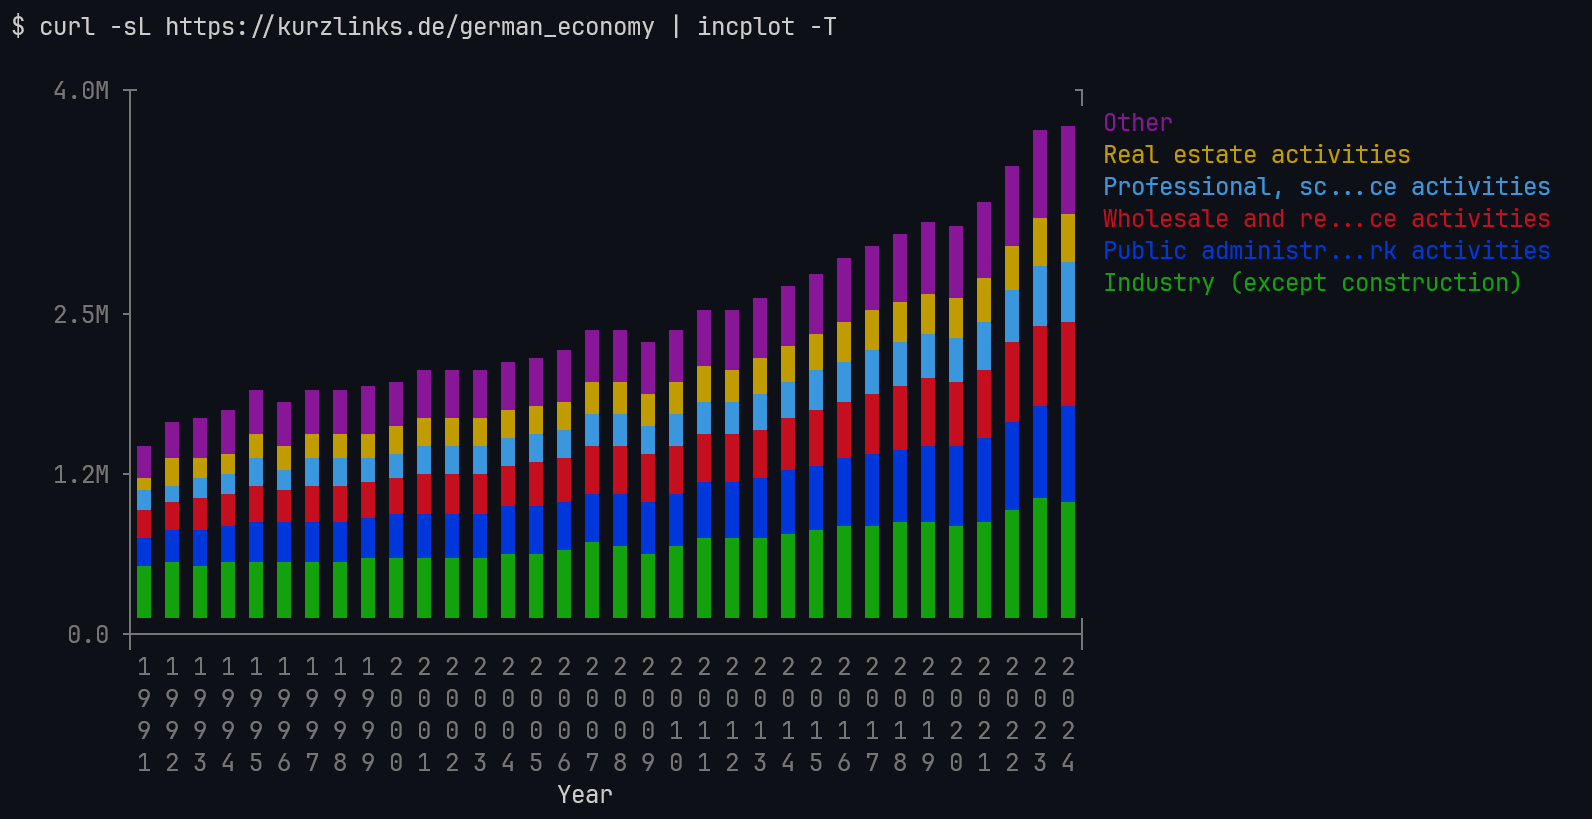
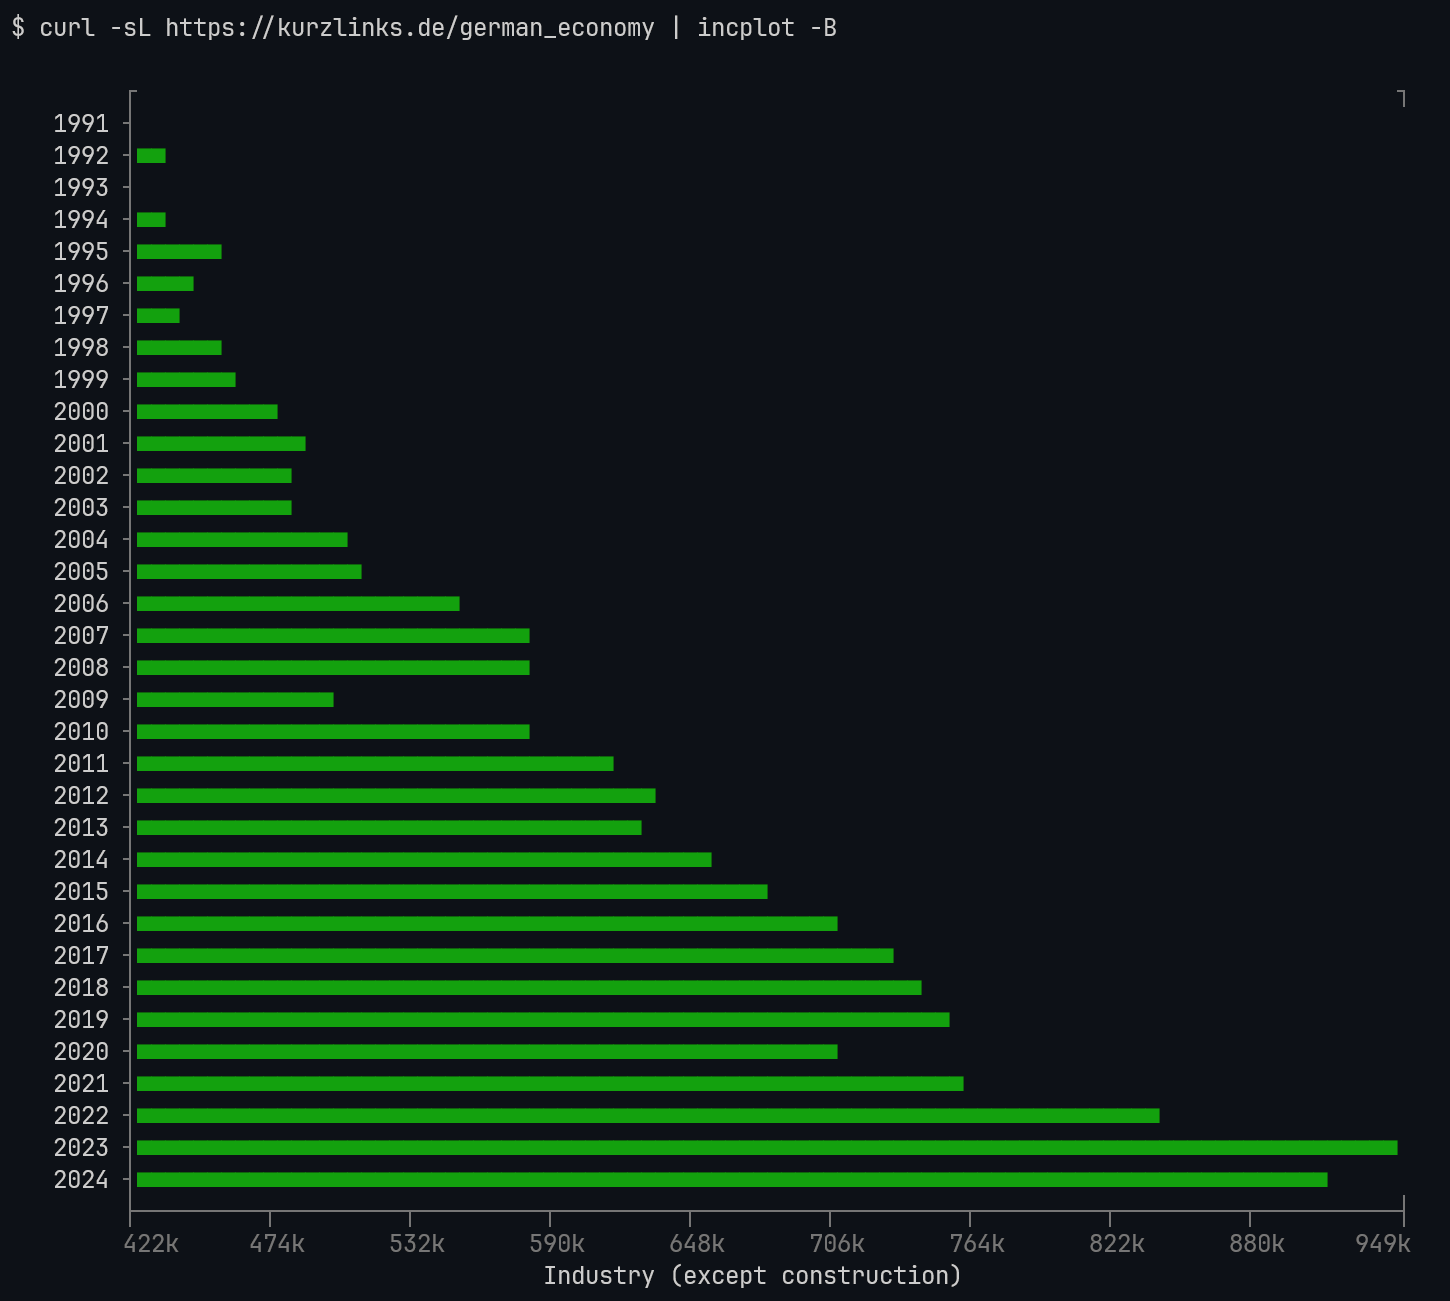
Automatically infers what to display and how based on the data piped in.
'As quick and as easy as possible' visualization of small to moderate sized data and information.
To quickly install incplot:
# Linux and macOS
brew install --cask InCom-0/incom/incplot
# Windows (with Scoop)
scoop bucket add incoms https://github.com/InCom-0/ScoopBucket_InCom
scoop install incoms/incplot
Otherwise there are precompiled releases in the repository itself.
- Great looking plots 'out of the box'
- Zero configuration required, super simple to use
- No command line arguments necessary most of the time due to automatic inferrence
- Mainstream platform support (Windows, Linux, MacOS)
- Users can optionally specify some or all arguments in any (sensible) combination
- Accepts piped in data in JSON, JSON Lines, NDJSON, CSV, TSV
- Blazingly fast
- Powerful coloring support through integrated color schemes
- Powerful ability to 'grab' currently used colors/scheme from the user's terminal and use it (if supported by the terminal app) with sensible fallback
- Automatic but configurable filtering of extreme values
- Automatic sizing
- Automatic value labels and scaling with metric prefixes
- Automatic string label sizing (ie. shortening where necessary)
- Automatic tickmarks
- Automatic legend
- Reasonable error messages (especially when the user asks for something that is impossible/unsupported)
The examples shown can be run directly as they are.
The data is pulled from this repository only routed through a link shortening service.
Please note that incplot checks whether the terminal windows is large enough (mostly meaning wide enough) to display the plot requested. If the users terminal windows is not large enough incplot will output an error message saying so. If that happens, the user can either change the size of the terminal windows so it is sufficient or choose a different plot type that might fit.
Multiline plot - gets inferred from this data if plot type isn't specified
curl -sL https://kurzlinks.de/german_economy | incplot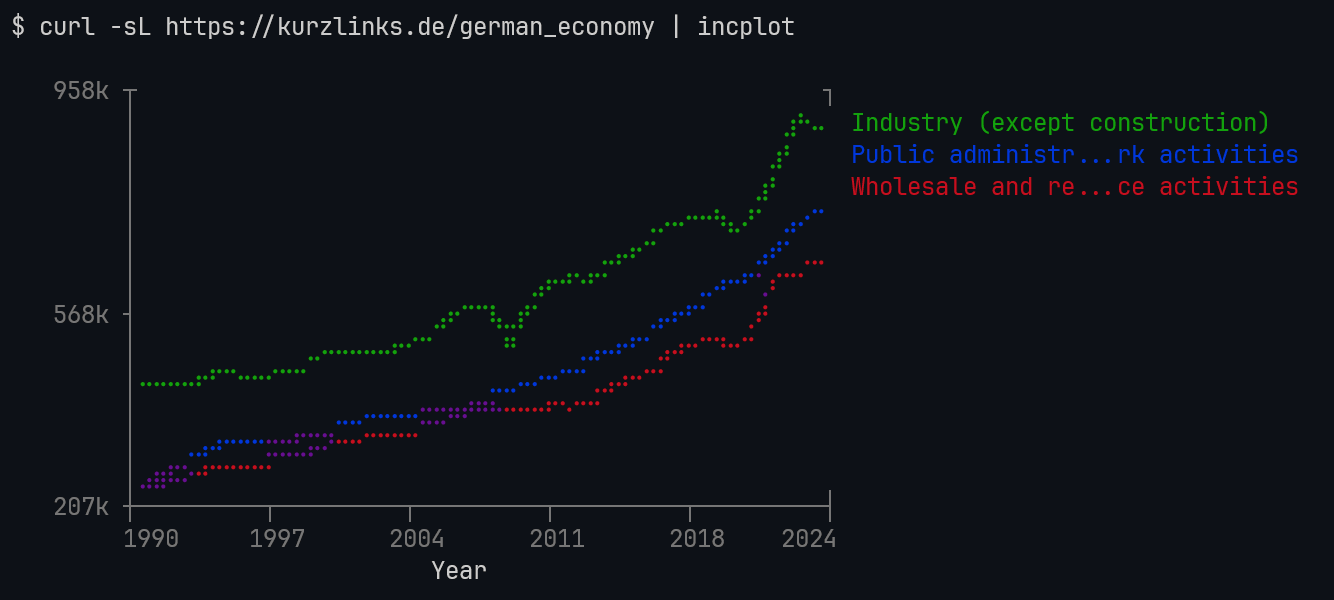
Horizontal multi bar plot
# Note that the size (notably width) is substantially larger and we have to limit the columns shown (depends on the users terminal windows size)
curl -sL https://kurzlinks.de/german_economy | incplot -H -y 2 3 4 5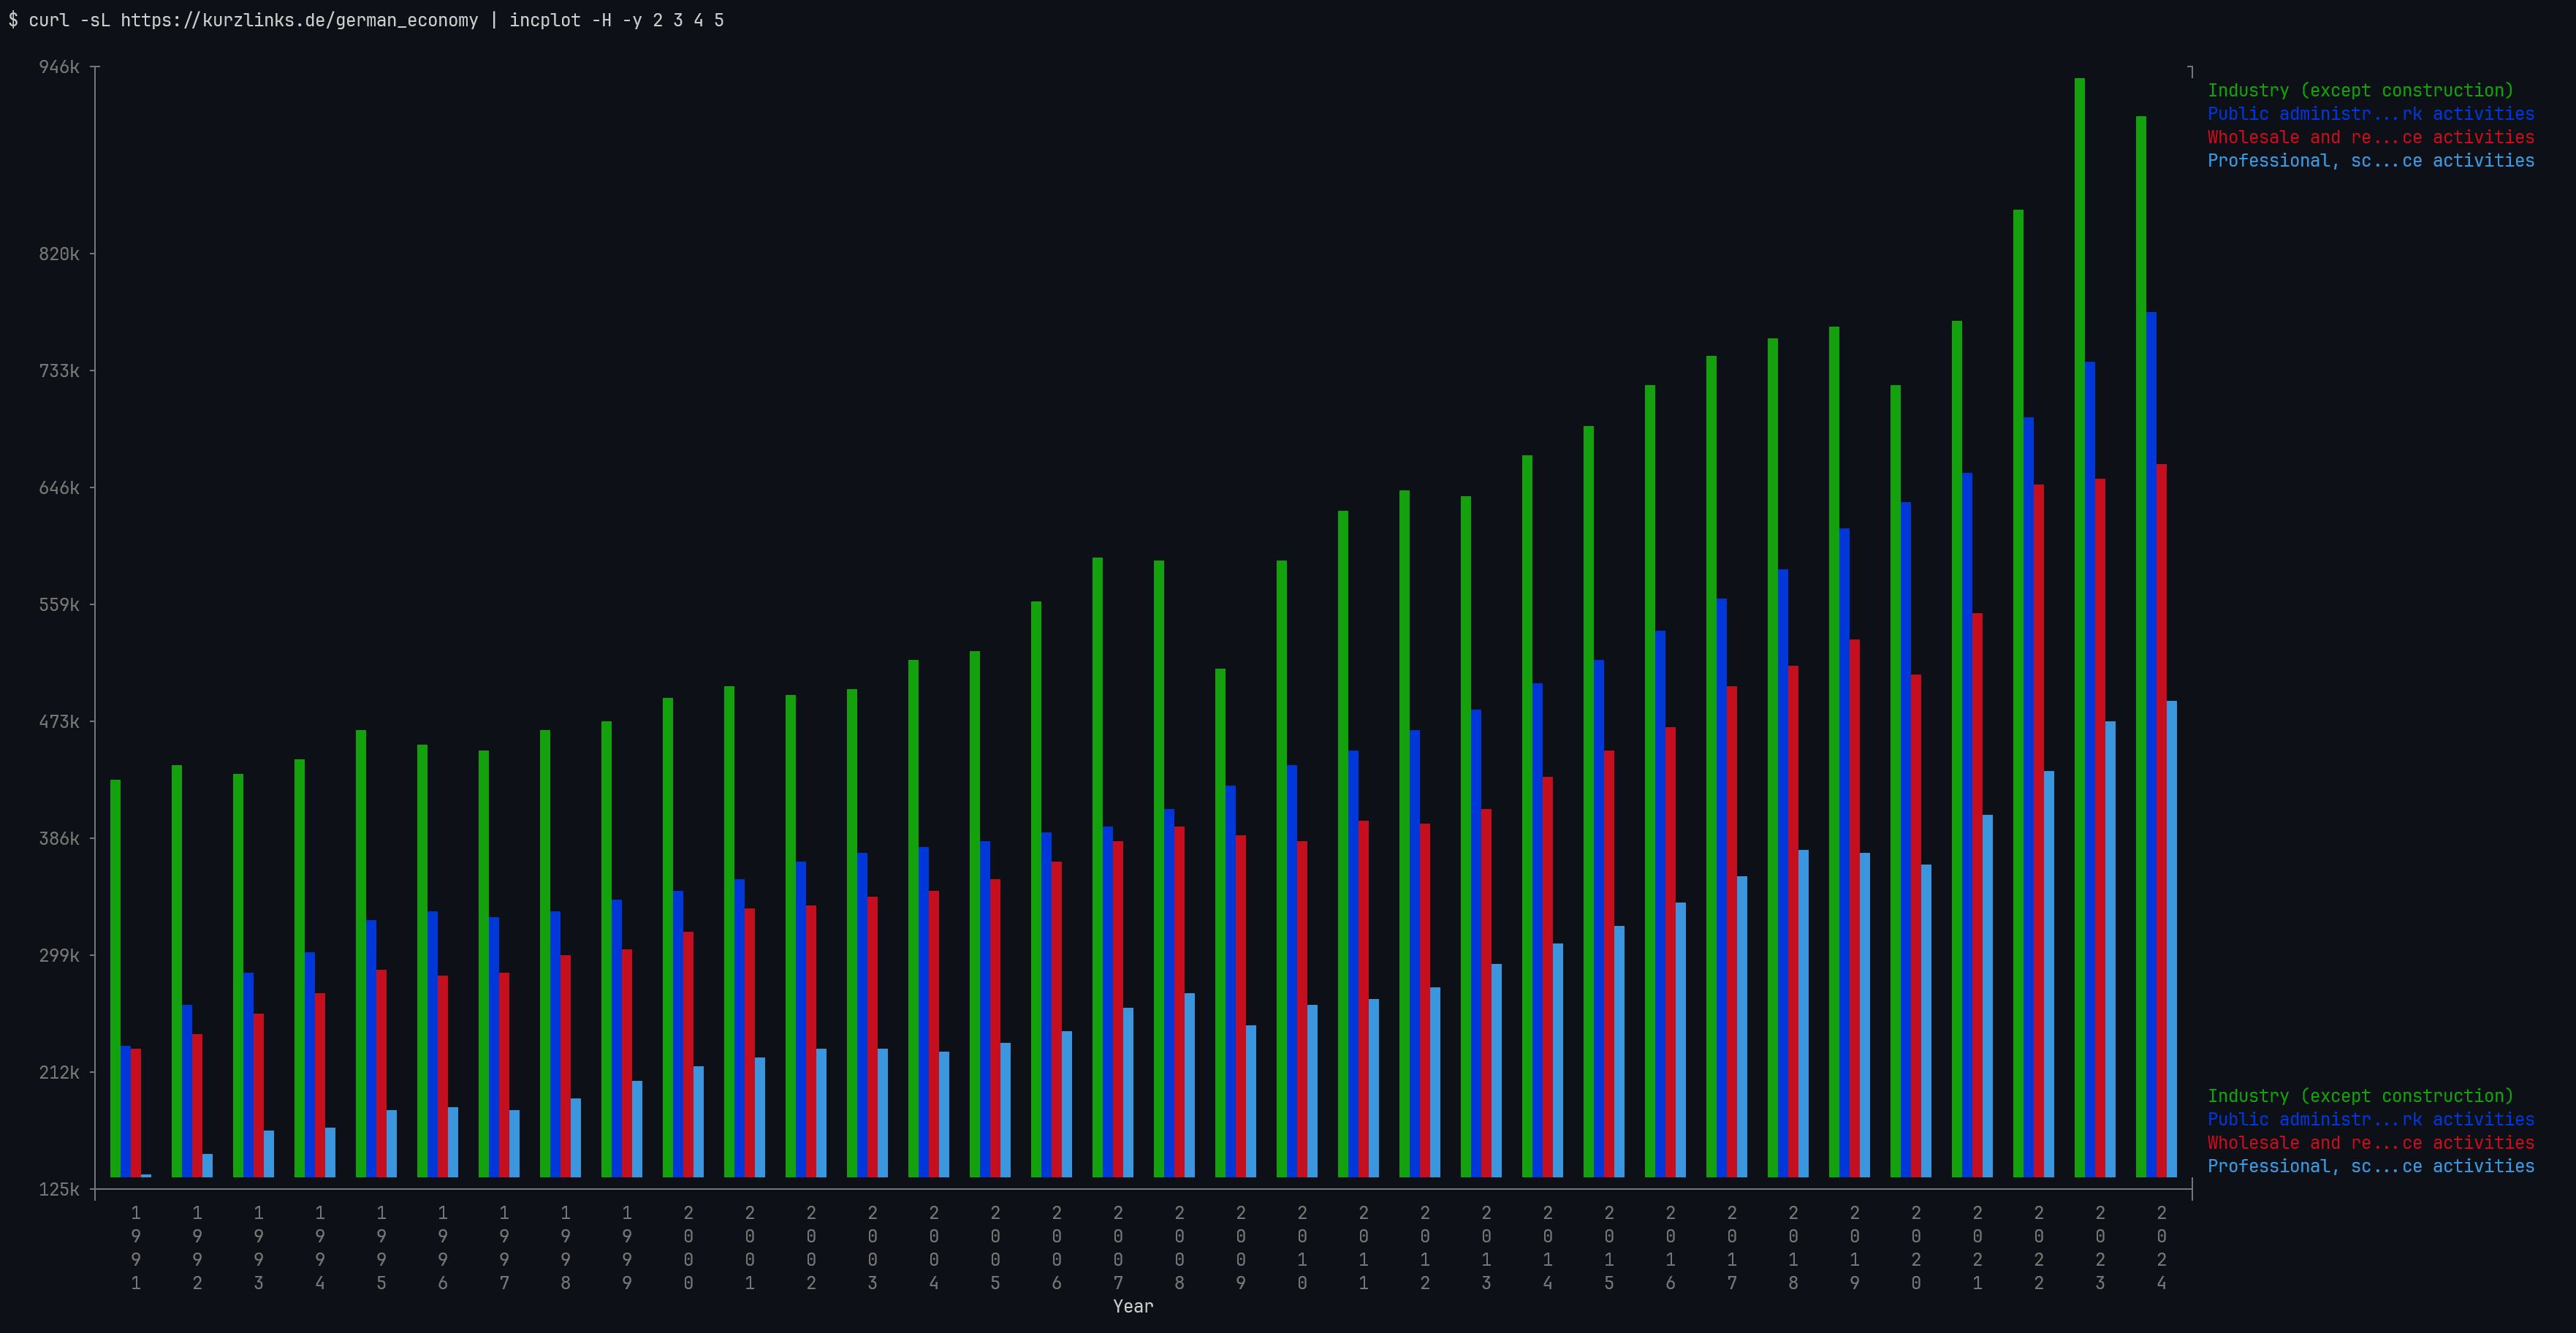
Scatter plot
# Note that some plot types might not be meaningful for every data set
curl -sL https://kurzlinks.de/german_economy | incplot -S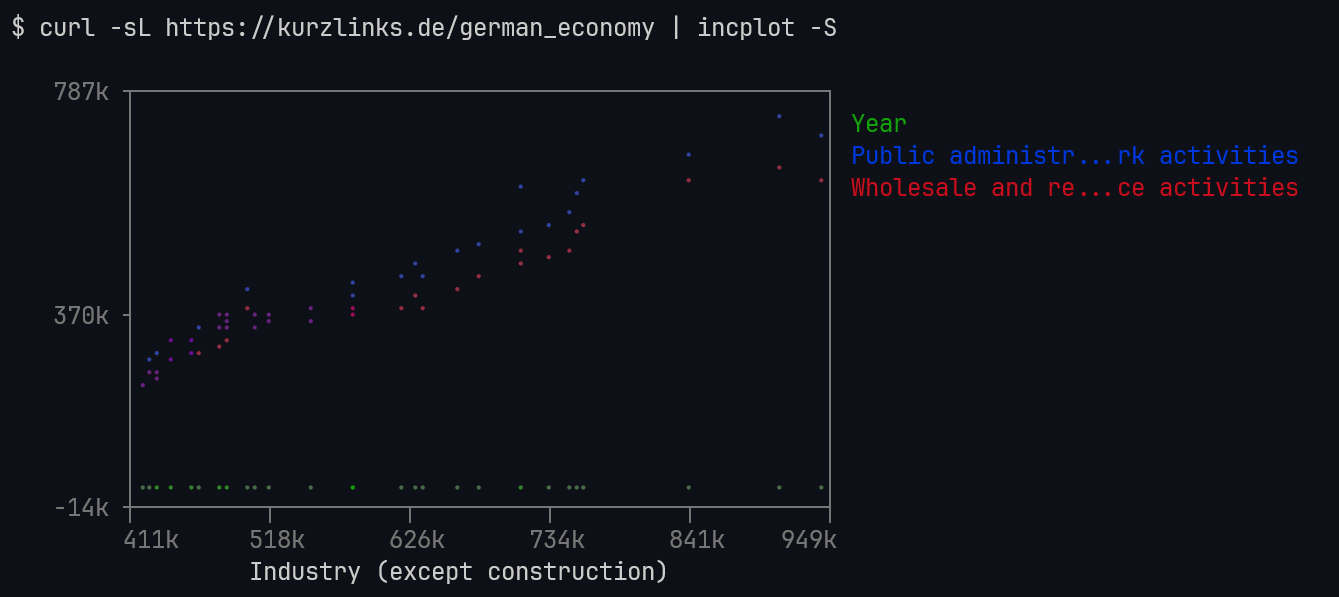
Incplot tries to be smart and makes an educated heuristic guess as to what it is the user wants displayed. However, it may not always succeed in guessing or guessing right. For this reason it is usually best to pipe in only the data (ie. the data columns) that the user wants displayed. It is especially not advisable to pipe in entire 'databases' worth of data of dozens of columns. If that is what the user is starting with it is generally advisable to use some dataframes library or the tools/features provided by your shell to do the heavy data wrangling upfront before piping the data into incplot.
Scatter plots tend to work better in smaller plot sizes (the dots are more 'densely' packed then which is typically visually nicer)
(Multi)line plots tend to work better in larger plot sizes (fullscreen even)
Horizontal bar plots (stacked or regular) have most of their width fully dependant on the data itself (ie. number of rows and number of value series selected). In practice this is a limiting factor for many datasets when using these plot types because the terminal window 'runs outs of' columns very quickly.
Vertical bar plots have their height fully dependant on the data itself (similarly to horizontal bar plots). However, terminal windows can scroll and so this is considered non-problematic.
The common case of having extreme values in the data that would normally prevent drawing 'nice' and useful plots can be taken care of with the optional [-e VAR] command line parameter which instructs incplot to filter out all observations (ie. rows) with any value above and below VAR standard deviations from mean. Defaults to [-e 6]. [-e 0] turns this feature off.
- Export/Conversion into HTML. Proper support for this will require solid amount of non-trivial 'font engineering' ...
- Will not work on terminal emulators without proper unicode support (those are arguably ancient)
- No data wrangling or analysis of any kind
- Doesn't offer 'all the plot types in existence', but rather just several of the most useful types
- Accepts flat numbers, strings and booleans only (ie. doesn't parse 'complex' data types such as date/time formats from string back into their numeric representation)
- Doesn't understand or work with 'units' (ie. 10km will be treated as string not value 10 with unit 'kilometers')
- No export of the rendered plot into other formats (such as pictures)
- Not guaranteed to work well on terminal emulators without (true) color support
- Doesn't (and cannot) make data 'look good' if the data is fundamentally unsuitable for plotting
- Doesn't (and cannot) show 100% visual accuracy due to inherent limitations of terminal interfaces
Most of technical details of how the tool works under the hood are described in incplot-lib which is the underlying library implementing all the core features except those that are directly related to running in the terminal. All external dependencies (mostly lightweight header only libraries related to parsing) are included in incplot-lib
Building incplot requires CMake and should be possible using the (appropriate) predefined CMake presets.
- Uses cutting edge (as of September 2025) features from C++23 language as well as from C++23 STL extensively
- Compiles with GCC 14.2+ and Clang 20.1.3+ on Linux, MacOS
- Compiles with MSVC 19.44+, GCC 14.2+ (through MSYS2) and Clang 20.1.3+ (through MSYS2) on Windows
- Beware that as of September 2025 LLVM's libc++ doesn't (yet) support all the C++23 library features used by incplot. Therefore, if compiling with Clang, it is imperative to use libstdc++ (which is sort of irregular but possible)
- It is almost certainly impossible to compile with the more exotic compilers and toolings (as they are lagging further behind the mainstream ones in standard implementation)
- These limitations will no doubt subside as time passes and implementations get fully up to speed on modern C++.
This code is free to use under the terms of the MIT license.
Main inspirations drawn from: YouPlot and UnicodePlots.jl.


