
Category:Images with MATLAB source code
Media in category "Images with MATLAB source code"
The following 200 files are in this category, out of 201 total.
(previous page) (next page)-
 16Mcolors.png 4,096 × 4,096; 55 KB
-
 Amoeba of p=w-2z-1.png 1,479 × 1,483; 24 KB
-
 Amoeba2.png 1,504 × 1,446; 13 KB
-
 Amoeba2.svg 940 × 904; 1 KB
-
 Amoeba3.png 1,267 × 1,006; 12 KB
-
 Amoeba4 400.png 1,896 × 1,917; 263 KB
-
 Ampersandcurve.png 844 × 1,061; 43 KB
-
 Analytic continuation along a curve.png 408 × 1,006; 32 KB
-
 Argument principle1.png 200 × 168; 7 KB
-
 Bernoulli inequality.png 556 × 1,056; 28 KB
-
 BicubicInterpolationExample.png 1,976 × 1,540; 65 KB
-
 Biholomorphism illustration.svg 4,709 × 8,557; 43 KB
-
 BilinearInterpolExample.png 1,980 × 1,536; 57 KB
-
 Bilininterp.png 1,002 × 801; 27 KB
-
 Black and white wiggler.gif 500 × 500; 2.85 MB
-
 Carotid Fractal.png 800 × 702; 24 KB
-
 Cauchy sequence illustration.png 2,706 × 1,894; 76 KB
-
 Circle as convex metric space.png 1,103 × 1,081; 23 KB
-
 Circle charts.png 400 × 376; 19 KB
-
 Complex numbers addition.png 468 × 473; 16 KB
-
 Conformal map.svg 2,287 × 3,991; 2 KB
-
 Conjugate gradient illustration.svg 804 × 1,212; 2 KB
-
 Contour.png 640 × 457; 36 KB
-
 Convex outcome set of a multi-objective optimization problem.gif 360 × 392; 906 KB
-
 Convolution of box signal with itself.gif 474 × 145; 77 KB
-
 Convolution of box signal with itself2.gif 468 × 147; 83 KB
-
 Convolution of spiky function with box.gif 475 × 144; 106 KB
-
 Convolution of spiky function with box2.gif 468 × 135; 76 KB
-
 Damped spring.gif 110 × 359; 207 KB
-
 Data Fusion - Scatter plot.png 719 × 651; 22 KB
-
 Dirac function approximation.gif 200 × 335; 89 KB
-
 Discontinuity essential.eps.png 2,506 × 1,700; 83 KB
-
 Discontinuity jump.eps.png 2,122 × 1,978; 81 KB
-
 Discontinuity removable.eps.png 2,506 × 1,844; 72 KB
-
 Discrete probability distribution illustration.png 1,806 × 2,033; 44 KB
-
 Double torus illustration.png 985 × 1,077; 260 KB
-
 DragonCurve animation.gif 641 × 480; 143 KB
-
 Drini-conjugatehyperbolas.svg 512 × 512; 2 KB
-
 Drum vibration mode01.gif 249 × 161; 200 KB
-
 Drum vibration mode02.gif 252 × 169; 200 KB
-
 Drum vibration mode11.gif 248 × 130; 214 KB
-
 Drum vibration mode12.gif 249 × 170; 148 KB
-
 Drum vibration mode13.gif 250 × 130; 137 KB
-
 Drum vibration mode21.gif 248 × 130; 230 KB
-
 Drum vibration mode22.gif 248 × 130; 239 KB
-
 Drum vibration mode23.gif 250 × 130; 245 KB
-
 Empirical CDF.png 400 × 320; 6 KB
-
 Exp series.gif 292 × 392; 51 KB
-
 Extreme points illustration.png 427 × 396; 10 KB
-
 Finite element method 1D illustration1.png 1,002 × 651; 42 KB
-
 Finite element method 1D illustration2.png 1,002 × 651; 55 KB
-
 Finite element triangulation.svg 815 × 815; 207 KB
-
 Five point stencil illustration.png 2,192 × 2,408; 106 KB
-
 Fractal fern-Barnsley animation.gif 828 × 573; 84 KB
-
 Gauss Newton illustration.png 1,532 × 1,236; 53 KB
-
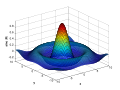
 Gaussian 2d.png 1,014 × 774; 62 KB
-
 Gaussian 3D - brown.png 761 × 848; 42 KB
-
 Gold Spider SEM sample Sharp.jpg 538 × 870; 96 KB
-
 Golden Mean Quadratic Siegel Disc Speed.png 1,000 × 1,000; 279 KB
-
 Gradient descent.png 482 × 529; 25 KB
-
 Gradient descent.svg 512 × 549; 56 KB
-
 Heat eqn.gif 200 × 136; 500 KB
-
 Helmholtz solution.png 975 × 1,957; 23 KB
-
 Heronian trig.png 212 × 144; 2 KB
-
 Homotopy with fixed endpoints.png 944 × 1,078; 39 KB
-
 Image coherent noise example.png 512 × 512; 5 KB
-
 Image gaussian noise example.png 512 × 512; 231 KB
-
 Image salt pepper noise example.png 512 × 512; 30 KB
-
 Image shot noise example.png 512 × 512; 161 KB
-
 Indicator function illustration.png 813 × 516; 19 KB
-

-
 Inversion illustration2.png 503 × 503; 19 KB
-
 Inversion illustration3.png 503 × 503; 26 KB
-
 Ironattenuation.PNG 1,400 × 950; 80 KB
-
 Jordan illustration.png 1,064 × 1,006; 55 KB
-
 Kampyle Eudoxus.png 622 × 1,092; 13 KB
-
 KochCube Animation Gray.gif 1,201 × 901; 448 KB
-
 Laplaces method.png 406 × 1,036; 23 KB
-
 Lens and wavefronts.gif 183 × 356; 35 KB
-
 Level grad.png 358 × 336; 70 KB
-
 Level grad.svg 512 × 512; 249 KB
-
 Level set method.jpg 800 × 600; 89 KB
-
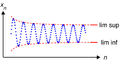 LimSup.png 996 × 509; 46 KB
-
 Linear least squares example.png 428 × 526; 12 KB
-
 Linear least squares example2.png 1,245 × 1,569; 52 KB
-
 Linear least squares2.png 889 × 1,067; 30 KB
-
 Mathbot.svg 187 × 257; 11 KB
-
 Matlab Logo.png 2,529 × 2,264; 508 KB
-
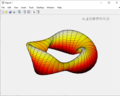 Matlab Plot of a Cruller.png 701 × 558; 42 KB
-
 MATLAB surf sinc3D.svg 512 × 384; 1.31 MB
-
 MATLABCChart.png 560 × 420; 4 KB
-
 MATLABEWMAChart.png 560 × 420; 4 KB
-
 MATLABIndividualsChartForPairedIndividualsAndMRChart.png 560 × 420; 4 KB
-
 MATLABMovingAverageChart.png 561 × 420; 4 KB
-
 MATLABMRChartForPairedIndividualsAndMRChart.png 560 × 420; 4 KB
-
 MATLABNPChart.png 561 × 420; 4 KB
-
 MATLABPChart.png 560 × 420; 4 KB
-
 MATLABRChartForPairedXBarAndRChart.png 560 × 420; 4 KB
-
 MATLABSChartForPairedXBarAndSChart.png 560 × 420; 4 KB
-
 MATLABUChart.png 560 × 420; 4 KB
-
 MATLABXBarChartForPairedXBarAndRChart.png 560 × 420; 4 KB
-
 MATLABXBarChartForPairedXBarAndSChart.png 561 × 420; 4 KB
-
 Maximum modulus principle.png 675 × 711; 30 KB
-
 Mesh.png 640 × 457; 321 KB
-
 Midpoint method illustration.png 1,863 × 1,667; 65 KB
-
 ML expansion illustration.png 1,621 × 1,508; 77 KB
-
 ML-star.png 1,621 × 1,508; 129 KB
-
 Mollifier illustration.png 500 × 158; 6 KB
-
 Mollifier movie.gif 624 × 387; 372 KB
-
 MonteCarloIntegrationCircle.png 360 × 360; 5 KB
-
 Nanoribbon Conductance.PNG 3,389 × 2,380; 50 KB
-
 Newton iteration.png 2,406 × 1,978; 55 KB
-
 Newton optimization vs grad descent.svg 813 × 936; 48 KB
-
 Non-analytic smooth function.png 376 × 124; 5 KB
-
 NonConvex.gif 360 × 392; 782 KB
-
 Normal and tangent illustration.png 1,314 × 1,272; 57 KB
-
 Notch 50Hz audio filter.svg 801 × 658; 2 KB
-
 Numerical integration illustration, h=0.25.png 1,500 × 2,183; 85 KB
-
 Numerical integration illustration, h=1.png 1,500 × 2,183; 72 KB
-
 NyquistPT1Tt.svg 512 × 512; 19 KB
-
 Parabolic trajectory.svg 512 × 212; 8 KB
-
 Partial transmittance.gif 367 × 161; 67 KB
-
 Partition of unity illustration.svg 5,400 × 891; 12 KB
-
 Parzen window illustration.png 635 × 103; 13 KB
-
 Parzen window illustration.svg 620 × 88; 26 KB
-
 Pedal line illustration.png 427 × 453; 39 KB
-
 Pedal trig illustration.png 570 × 447; 17 KB
-
 PeriodicVoronoiTessellation.png 2,048 × 2,048; 152 KB
-
 Phase vs Time, wrapped and unwrapped.jpg 757 × 390; 129 KB
-
 Phase-shift illustration.png 485 × 485; 5 KB
-
 Photon Cross Sections.png 1,280 × 929; 55 KB
-
 Photon Mass Attenuation Coefficients.png 1,280 × 908; 55 KB
-
 Photon Mean Free Path.png 1,097 × 855; 36 KB
-
 Piecewise linear function2D.svg 443 × 443; 60 KB
-
 Plane wave.gif 145 × 356; 34 KB
-
 Plane wave.png 486 × 981; 4 KB
-
 Plot2.png 640 × 463; 7 KB
-
 Polar.png 629 × 439; 54 KB
-
 Quasiconvex function.png 501 × 358; 11 KB
-
 Random walk in2D closeup.png 842 × 989; 29 KB
-
 Random walk in2D.png 661 × 989; 40 KB
-
 Relaxation longitudinal magnetization.svg 1,500 × 625; 109 KB
-
 Right concoid.svg 560 × 600; 2.28 MB
-
 Rosenbrock function.svg 720 × 540; 2.28 MB
-
 Rotating black and white squares.gif 500 × 500; 2.52 MB
-
 Rotation illustration.png 936 × 989; 19 KB
-
 Rotation illustration2.svg 1,005 × 897; 12 KB
-
 Scalloping and noise floor comparisons (2 window functions).png 562 × 457; 22 KB
-
 Scattering theory illust.png 480 × 1,988; 49 KB
-
 Schwarz-Christoffel transformation.png 580 × 177; 7 KB
-
 Second order system response to step input.png 560 × 420; 11 KB
-
 Serpentine curve.png 2,054 × 371; 8 KB
-
 Signed distance1.png 1,025 × 1,903; 31 KB
-
 Signed distance2.png 1,025 × 1,856; 38 KB
-
 Simple set1.png 1,267 × 1,014; 6 KB
-
 Simple set2.png 1,267 × 1,014; 6 KB
-
 Snells law wavefronts.gif 225 × 227; 65 KB
-
 Snells law wavefronts.png 360 × 314; 62 KB
-
 Snells law wavefronts.svg 410 × 342; 68 KB
-
 Spectral leakage from a sinusoid and rectangular window.png 508 × 412; 47 KB
-
 Sphere with three handles.png 1,308 × 1,004; 389 KB
-
 Spherical mean.png 526 × 631; 38 KB
-
 Spherical wave2.gif 178 × 178; 117 KB
-
 Spring beforeresonance.gif 435 × 290; 230 KB
-
 Spring pastresonance.gif 435 × 340; 344 KB
-
 Spring resonance simple.gif 334 × 343; 279 KB
-
 Spring resonance.gif 338 × 343; 308 KB
-
 Standard deviation.svg 512 × 411; 12 KB
-
 Stehende Welle.gif 640 × 480; 910 KB
-
 SunflowerModel.svg 512 × 512; 147 KB
-
 Superposition of circles.png 2,000 × 2,000; 1.05 MB
-
 Surface normal illustration.png 1,379 × 1,488; 24 KB
-
 Surface of revolution illustration.png 693 × 885; 130 KB
-
 Surface vectors.png 1,455 × 807; 80 KB
-
 Swastica curve3.png 587 × 579; 19 KB
-
 Syntractrix a=0.5 b=1.png 2,025 × 554; 21 KB
-
 Syntractrix a=1.5 b=1.png 2,025 × 554; 25 KB
-
 TonnetzTorus.gif 900 × 490; 3.21 MB
-
 Torus illustration.png 900 × 594; 147 KB
-
 Total variation.gif 179 × 236; 57 KB
-
 Trace operator illustration.png 660 × 1,842; 43 KB
-
 Triple torus array.png 1,123 × 990; 250 KB
-
 Triple torus illustration.png 2,204 × 1,550; 670 KB
-
 Tschirnhausen cubic.png 1,100 × 1,638; 63 KB
-
 Tubular neighborhood.png 2,506 × 1,967; 374 KB
-
 Tubular neighborhood3.png 928 × 1,289; 24 KB
-
 TV pic1.png 825 × 989; 18 KB
-
 TV pic2.png 886 × 989; 19 KB
-
 TV pic3.png 786 × 644; 11 KB
-
 Two dim standing wave.gif 200 × 140; 142 KB
-
 Two sources interference.gif 200 × 200; 162 KB
-
 Ueberlagerung gegenlaeufiger Wellen -01.gif 435 × 343; 313 KB
-
 Volume under surface.png 636 × 762; 56 KB
-
 Wave equation 1D fixed endpoints.gif 274 × 121; 129 KB
-
 Wave packet.svg 5,478 × 3,964; 29 KB
-
 Window function (gauss).svg 883 × 346; 484 KB
-
 Window function (hamming).svg 907 × 346; 455 KB
-
 Window function (hann).svg 906 × 346; 477 KB
-
 Window function (Kaiser; alpha = 2 pi).png 1,761 × 597; 81 KB
-
 Window function (Kaiser; alpha = 3 pi).png 1,785 × 607; 84 KB


.png)


