
Category:2018 maps of Europe
Temperate regions: North America · South America · Africa · Europe · Asia · Oceania – Polar regions: – Other regions:
English: 2018 maps of Europe
Español: Mapas de Europa en 2018
Suomi: Euroopan kartat vuodelta 2018
Română: Hărți ale Europei din 2018
Subcategories
This category has the following 19 subcategories, out of 19 total.
A
- 2018 maps of Armenia (2 F)
D
E
- 2018 maps of Estonia (2 F)
F
- 2018 maps of Finland (1 F)
- 2018 maps of France (8 F)
G
I
L
- 2018 maps of Latvia (1 F)
- 2018 maps of Lithuania (2 F)
M
- 2018 maps of Moldova (1 F)
N
- 2018 maps of Norway (1 F)
R
- 2018 maps of Russia (3 F)
S
- 2018 maps of Spain (17 F)
- 2018 maps of Sweden (7 F)
- 2018 maps of Switzerland (11 F)
T
- Tour de France maps 2018 (2 F)
U
Media in category "2018 maps of Europe"
The following 200 files are in this category, out of 293 total.
(previous page) (next page)-
 20171201 DailyMap Migrants UPT.pdf 1,754 × 1,239; 744 KB
-
 2018 EBSL map of nations.svg 8,579 × 6,969; 506 KB
-
 2018 Euro Beach Soccer League map of nations.svg 8,579 × 6,969; 259 KB
-
 2018 Europe.svg 680 × 482; 681 KB
-
 2018 European Women's Handball Championship.png 922 × 768; 145 KB
-
 2018-02-24 CPC weekly temperature anomaly in Europe.png 2,700 × 2,700; 334 KB
-
 2018-03-01 Deutschland NASA Aqua-MODIS via Worldview.jpg 8,385 × 6,369; 5.59 MB
-
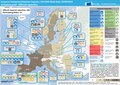
 2018-03-03 CPC weekly temperature anomaly in Europe.png 2,700 × 2,700; 280 KB
-
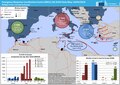
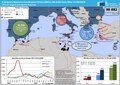
 20180202 DailyMap RefugeeCrisis CentralMediterraneanRoute.pdf 1,754 × 1,239; 694 KB
-
 20180221 SeismicHazard DailyMap02.pdf 1,754 × 1,239; 743 KB
-
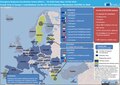
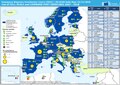
 20180222 VoluntaryPool OfferedCapacities.pdf 1,754 × 1,239; 909 KB
-
 20180223 DailyMap VoluntaryPool OfferedCapacities.pdf 1,754 × 1,239; 913 KB
-
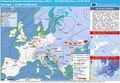
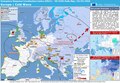
 20180301 DailyMap FSCexercises.pdf 1,754 × 1,239; 507 KB
-
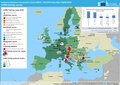
 20180315 DailyMap EUCPM Activations.pdf 1,754 × 1,239; 497 KB
-
 20180315 DailyMap EUCPM RfA.pdf 1,754 × 1,239; 554 KB
-
 20180316 VoluntaryPoolinCECIS.pdf 1,754 × 1,239; 768 KB
-
 20180420 DailyMap migration crisis CEW.pdf 1,754 × 1,239; 800 KB
-
 20180508 UCPM Training DailyMap.pdf 1,754 × 1,239; 1.13 MB
-
 20180626 DailyMap VoluntaryPool OfferedCapacities.pdf 1,754 × 1,239; 913 KB
-
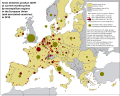
 20180913 Forest fires in Europe OVERVIEW 2018 FINAL.pdf 1,754 × 1,239; 909 KB
-
 20180925 VoluntaryPool OfferedCapacities.pdf 1,754 × 1,239; 922 KB
-
 20180927 DailyMap migration crisis CEW.pdf 1,754 × 1,239; 631 KB
-
 20181017 DailyMap MODEX2.pdf 1,754 × 1,239; 818 KB
-
 20181123 DM FSCexercises lu.pdf 1,754 × 1,239; 746 KB
-
 20181130 VoluntaryPool OfferedCapacities.pdf 1,754 × 1,239; 929 KB
-
 20181211 DailyMap migration crisis CEW v3.pdf 1,754 × 1,239; 818 KB
-
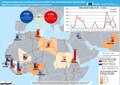
 Access to clean fuels and technologies for cooking, Europe, 2018.svg 850 × 721; 170 KB
-
 AECR map 2018-09-11.png 1,532 × 1,162; 178 KB
-

-

-
 Age standardized deaths from all causes, Europe, 2018.svg 850 × 677; 154 KB
-
 Agriculture share gdp, Europe, 2018.svg 850 × 600; 157 KB
-
 Air passenger kilometers, Europe, 2018.svg 850 × 600; 154 KB
-
 Air passengers carried, Europe, 2018.svg 850 × 600; 155 KB
-
 Air transport freight ton km, Europe, 2018.svg 850 × 600; 155 KB
-
 Air trips per capita, Europe, 2018.svg 850 × 600; 157 KB
-
 Annual healthcare expenditure per capita, Europe, 2018.svg 850 × 736; 170 KB
-
 Annual-healthcare-expenditure-per-capita,Europe,2018.svg 850 × 736; 169 KB
-
 Apple production, Europe, 2018.svg 850 × 600; 170 KB
-
 Armed forces personnel of total labor force, Europe, 2018.svg 850 × 600; 159 KB
-
 Armed forces personnel percent, Europe, 2018.svg 850 × 600; 158 KB
-
 Asthma prevalence, Europe, 2018.svg 850 × 677; 154 KB
-
 Avocado production, Europe, 2018.svg 850 × 600; 169 KB
-
 Banana production, Europe, 2018.svg 850 × 600; 170 KB
-
 Barley production, Europe, 2018.svg 850 × 600; 169 KB
-
 Bean production, Europe, 2018.svg 850 × 600; 170 KB
-
 Beef and buffalo meat production tonnes, Europe, 2018.svg 850 × 600; 157 KB
-
 Cancer-death-rates,Europe,2018.svg 850 × 744; 169 KB
-
 Cardiovascular-disease-death-rates,Europe,2018.svg 850 × 744; 169 KB
-
 Cashew nut production, Europe, 2018.svg 850 × 600; 170 KB
-
 Cassava production, Europe, 2018.svg 850 × 600; 170 KB
-
 Cattle meat yields hectograms 100 grams per animal, Europe, 2018.svg 850 × 600; 157 KB
-
 Cereal production, Europe, 2018.svg 850 × 600; 168 KB
-
 Chicken meat production, Europe, 2018.svg 850 × 600; 169 KB
-
 Child mortality, Europe, 2018.svg 850 × 600; 157 KB
-
 Co2 emissions transport, Europe, 2018.svg 850 × 600; 154 KB
-
 Coal consumption per capita, Europe, 2018.svg 850 × 736; 169 KB
-
 Coal energy share, Europe, 2018.svg 850 × 818; 172 KB
-
 Cobalt production, Europe, 2018.svg 850 × 600; 154 KB
-
 Cocoa bean production, Europe, 2018.svg 850 × 600; 170 KB
-
 Coffee bean production, Europe, 2018.svg 850 × 600; 170 KB
-

-

-
 Crude birth rate, Europe, 2018.svg 850 × 600; 169 KB
-
 Crude death rate, Europe, 2018.svg 850 × 600; 152 KB
-
 Daily meat consumption per person, Europe, 2018.svg 850 × 600; 156 KB
-
 Daily median income, Europe, 2018.svg 850 × 774; 160 KB
-
 Daily-per-capita-protein-supply,Europe,2018.svg 850 × 600; 170 KB
-
 Dalys-rate-from-all-causes,Europe,2018.svg 850 × 677; 168 KB
-
 Death Penality in Europe.png 680 × 520; 138 KB
-
 Death rate from digestive diseases gbd, Europe, 2018.svg 850 × 691; 169 KB
-
 Death rate from drowning ghe, Europe, 2018.svg 850 × 600; 168 KB
-
 Death rate from fires and burns who, Europe, 2018.svg 850 × 600; 168 KB
-
 Death rate from maternal disorders ihme, Europe, 2018.svg 850 × 818; 170 KB
-
 Death rate from meningitis who, Europe, 2018.svg 850 × 600; 157 KB
-
 Death rate from obesity, Europe, 2018.svg 850 × 759; 173 KB
-
 Death rate from poisoning, Europe, 2018.svg 850 × 677; 168 KB
-
 Death rate from road accidents, Europe, 2018.svg 850 × 600; 153 KB
-
 Death rate from smoking, Europe, 2018.svg 850 × 662; 168 KB
-
 Death rate from strokes who, Europe, 2018.svg 850 × 774; 155 KB
-
 Death rates from high blood pressure gbd, Europe, 2018.svg 850 × 736; 155 KB
-
 Death rates from high blood pressure, Europe, 2018.svg 850 × 789; 170 KB
-
 Death rates substance disorders who, Europe, 2018.svg 850 × 662; 167 KB
-
 Death-rate-by-source-from-indoor-air-pollution,Europe,2018.svg 850 × 729; 170 KB
-
 Death-rate-from-opioid-use,Europe,2018.svg 850 × 677; 169 KB
-
 Death-rate-from-opioid-use-who,Europe,2018.svg 850 × 600; 152 KB
-
 Death-rate-from-suicides-ghe,Europe,2018.svg 850 × 600; 167 KB
-
 Death-rate-smoking,Europe,2018.svg 850 × 699; 156 KB
-
 Death-rates-cocaine,Europe,2018.svg 850 × 677; 168 KB
-
 Deaths from fires and burns, Europe, 2018.svg 850 × 600; 168 KB
-
 Deaths from liver disease, Europe, 2018.svg 850 × 691; 169 KB
-
 Deaths from parkinsons disease ghe, Europe, 2018.svg 850 × 721; 154 KB
-
 Deaths from substance disorders who, Europe, 2018.svg 850 × 662; 169 KB
-
 Dementia death rates, Europe, 2018.svg 850 × 744; 155 KB
-
 Dengue fever deaths, Europe, 2018.svg 850 × 706; 169 KB
-
 Dengue incidence, Europe, 2018.svg 850 × 706; 169 KB
-
 Dengue-fever-deaths,Europe,2018.svg 850 × 706; 169 KB
-
 Drowning death rates under 5, Europe, 2018.svg 850 × 600; 167 KB
-
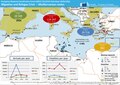
 ECDM 20180227 Europe Cold-Outbreak.pdf 1,625 × 1,125; 919 KB
-
 ECDM 20180302 Europe Cold-Wave.pdf 1,625 × 1,125; 912 KB
-
 ECDM 20180413 Europe Forestfires seasonal 2.pdf 1,625 × 1,125; 601 KB
-
 ECDM 20181030 Europe Severe-Weather.pdf 1,625 × 1,125; 1,016 KB
-
 Egg production thousand tonnes, Europe, 2018.svg 850 × 600; 158 KB
-
 Electric car sales share, Europe, 2018.svg 850 × 699; 155 KB
-
 Electricity as a share of primary energy, Europe, 2018.svg 850 × 706; 171 KB
-
 Electricity coal, Europe, 2018.svg 850 × 736; 170 KB
-
 Electricity demand, Europe, 2018.svg 850 × 736; 169 KB
-
 Energia nucleare UE.png 454 × 450; 61 KB
-

-
 Europe WorldRugby federations by number of registered players (2018).svg 499 × 404; 463 KB
-
 European countries as US states by GDP PPP per capita, 2018.jpg 3,683 × 2,850; 1.46 MB
-
 European countries by hourly minimum wage.jpg 4,095 × 2,850; 1.69 MB
-
 European countries by median wealth per adult, 2018.jpg 4,091 × 2,799; 2.06 MB
-
 European countries by population density per sq km.jpg 4,095 × 2,850; 1.43 MB
-
 Fatal occupational injuries among employees, Europe, 2018.svg 850 × 600; 153 KB
-
 Fish seafood production, Europe, 2018.svg 850 × 600; 168 KB
-
 Fossil fuel subsidies gdp, Europe, 2018.svg 850 × 600; 154 KB
-
 Fossil fuel subsidies per capita, Europe, 2018.svg 850 × 600; 154 KB
-
 Fossil fuels share energy, Europe, 2018.svg 850 × 818; 173 KB
-
 Freedom of Panorama in Europe.svg 828 × 696; 700 KB
-
 Gdp per capita worldbank, Europe, 2018.svg 850 × 833; 159 KB
-
 Gdp worldbank, Europe, 2018.svg 850 × 736; 158 KB
-
 Grapes production, Europe, 2018.svg 850 × 600; 169 KB
-
 Hartmut Feb27.png 1,165 × 819; 1.66 MB
-
 Health-expenditure-government-expenditure,Europe,2018.svg 850 × 662; 168 KB
-
 Hepatitis b incidence sdgs, Europe, 2018.svg 850 × 600; 168 KB
-
 Hepatitis death rate, Europe, 2018.svg 850 × 600; 169 KB
-
 Hepatitis-c-number-of-deaths,Europe,2018.svg 850 × 789; 170 KB
-
 Homicide rate unodc, Europe, 2018.svg 850 × 647; 169 KB
-
 Homicide-rate-unodc,Europe,2018.svg 850 × 647; 169 KB
-
 Human trafficking victims, Europe, 2018.svg 850 × 600; 158 KB
-
 Human-development-index,Europe,2018.svg 850 × 600; 167 KB
-
 Hydro share energy, Europe, 2018.svg 850 × 818; 172 KB
-
 Incidence-of-malaria,Europe,2018.svg 850 × 706; 170 KB
-
 Incidence-of-tuberculosis-sdgs,Europe,2018.svg 850 × 759; 169 KB
-
 Infectious and parasitic diseases death rate who mdb, Europe, 2018.svg 850 × 908; 159 KB
-
 Infectious disease death rates, Europe, 2018.svg 850 × 677; 168 KB
-
 Insecticide use, Europe, 2018.svg 850 × 600; 157 KB
-
 Ivf 2017-1.jpg 4,267 × 3,200; 700 KB
-
 Labor productivity per hour pennworldtable, Europe, 2018.svg 850 × 833; 158 KB
-
 Landline internet subscriptions, Europe, 2018.svg 850 × 600; 154 KB
-
 Law mandate nondiscrimination hiring, Europe, 2018.svg 850 × 600; 155 KB
-
 Leading cause of death, Europe, 2018.svg 850 × 600; 154 KB
-
 Learning-adjusted-years-of-school-lays,Europe,2018.svg 850 × 706; 169 KB
-
 Legal requirements for ritual slaughter in Europe 2018.png 3,381 × 3,195; 2.5 MB
-
 Legislation domestic violence, Europe, 2018.svg 850 × 600; 155 KB
-
 Life expectancy by Eurostat in regions -2018 -lite.png 1,650 × 1,400; 675 KB
-
 Life expectancy by Eurostat in regions -2018.png 1,650 × 1,400; 711 KB
-
 Life-expectancy,Europe,2018.svg 850 × 691; 157 KB
-
 Lithium production, Europe, 2018.svg 850 × 600; 154 KB
-
 Long run birth rate, Europe, 2018.svg 850 × 600; 169 KB
-
 Low carbon electricity, Europe, 2018.svg 850 × 833; 169 KB
-
 Low carbon share energy, Europe, 2018.svg 850 × 818; 171 KB
-
 Malnutrition death rates, Europe, 2018.svg 850 × 677; 157 KB
-
 Map night trains in europe.png 6,299 × 6,299; 4.42 MB
-
 Map of populous Europe (physical, political, population) with legend.jpg 3,720 × 2,773; 3.76 MB
-
 Maternal-mortality,Europe,2018.svg 850 × 766; 169 KB
-
 Meat-supply-per-person,Europe,2018.svg 850 × 600; 169 KB
-
 Metropolitan GDPs of Europe 2018.svg 2,592 × 2,055; 631 KB
-
 Military expenditure as a share of government spending, Europe, 2018.svg 850 × 600; 158 KB
-
 Military spending sipri, Europe, 2018.svg 850 × 600; 158 KB
-
 Military-spending-as-a-share-of-gdp-sipri,Europe,2018.svg 850 × 600; 168 KB
-
 Military-spending-sipri,Europe,2018.svg 850 × 600; 169 KB
-
 Milk production tonnes, Europe, 2018.svg 850 × 600; 158 KB
-
 Milk yields per animal, Europe, 2018.svg 850 × 600; 158 KB
-
 Mortality from ncds sdgs, Europe, 2018.svg 850 × 1,080; 160 KB
-
 Mortality neonatal asphyxia and trauma, Europe, 2018.svg 850 × 600; 154 KB
-
 Neonatal-mortality-wdi,Europe,2018.svg 850 × 600; 169 KB
-
 New infections with tetanus, Europe, 2018.svg 850 × 600; 168 KB
-
 New neonatal tetanus cases per million, Europe, 2018.svg 850 × 600; 168 KB
-
 Nuclear primary energy, Europe, 2018.svg 850 × 818; 172 KB
-
 Number airline passengers, Europe, 2018.svg 850 × 600; 153 KB
-
 Number of internet users, Europe, 2018.svg 850 × 691; 154 KB
-
 Number of people severely food insecure, Europe, 2018.svg 850 × 736; 160 KB
-
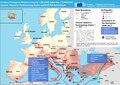
 Number of refugees per 100000, Europe, 2018.svg 850 × 766; 159 KB
-
 Number-of-deaths-from-malaria-who,Europe,2018.svg 850 × 706; 170 KB
-
 Number-of-deaths-from-tetanus,Europe,2018.svg 850 × 600; 168 KB
-
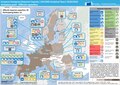
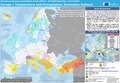
 NWS-NOAA Europe Percentage of Normal Precipitation DEC 30, 2018 - JAN 5, 2019.png 2,700 × 2,700; 230 KB
-
 Obesity prevalence adults who gho, Europe, 2018.svg 850 × 953; 171 KB
-
 Oil share energy, Europe, 2018.svg 850 × 818; 173 KB
-
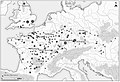 Oppidum map.jpg 553 × 377; 153 KB
-
 Orange production, Europe, 2018.svg 850 × 600; 169 KB
-
 Overarching-legal-frameworks-regarding-gender-equality,Europe,2018.svg 850 × 600; 205 KB
-
 Parkinsons-disease-prevalence-ihme,Europe,2018.svg 850 × 721; 201 KB
-
 Pea production, Europe, 2018.svg 850 × 600; 171 KB
-
 Per capita co2 aviation, Europe, 2018.svg 850 × 600; 154 KB
-
 Per capita co2 emissions from domestic aviation, Europe, 2018.svg 850 × 600; 158 KB
-
 Per capita co2 transport, Europe, 2018.svg 850 × 600; 153 KB
-
 Per capita egg consumption kilograms per year, Europe, 2018.svg 850 × 600; 158 KB
-
 Per capita electricity demand, Europe, 2018.svg 850 × 736; 169 KB
-
 Per capita energy use, Europe, 2018.svg 850 × 930; 170 KB
-
 Per capita gas, Europe, 2018.svg 850 × 736; 170 KB
-
 Per capita hydro, Europe, 2018.svg 850 × 930; 172 KB
-
 Per capita nuclear, Europe, 2018.svg 850 × 930; 172 KB
-
 Per capita oil, Europe, 2018.svg 850 × 736; 170 KB
-
 Per capita solar, Europe, 2018.svg 850 × 930; 172 KB
-
 Per capita wind, Europe, 2018.svg 850 × 930; 172 KB
-
 Per-capita-energy-use,Europe,2018.svg 850 × 930; 170 KB
-
 Period average age of mothers, Europe, 2018.svg 850 × 600; 168 KB
-
 Pesticide use per hectare of cropland, Europe, 2018.svg 850 × 600; 157 KB


.svg)
.svg)


_with_legend.jpg)


