Debug chat interactions
When an agent behaves unexpectedly, inspect the evidence from the affected chat session before changing your prompt or configuration. This article helps you select a diagnostic view, trace what happened, and verify whether a change resolves the issue.
Choose a diagnostic tool
VS Code provides complementary tools for different questions:
| Question | Tool |
|---|---|
| What happened, and in what order? | Use the Logs view in the Agent Debug Logs panel. |
| How long did the session take, how many tokens did it use, and were there errors? | Use the Summary view. |
| How did agents and subagents interact? | Use the Agent flow chart view. |
| What prompt, context, and tools were sent to the model? | Use the Chat Debug view. |
| Did changes between requests reduce reported cache reuse? | Use the Cache Explorer. |
| Can the AI summarize the captured events for me? | Attach debug events to chat or use /troubleshoot. |
For account, connectivity, or feature-availability problems, start with Troubleshoot AI in VS Code instead.
Before you start
The Agent Debug Logs panel is in Preview.
Prepare logging before you reproduce the issue:
- For local chat sessions in the main VS Code window, enable the experimental
github.copilot.chat.agentDebugLog.fileLogging.enabled
setting and reload the window before you use
/troubleshoot. - For sessions that run on the Agent Host, enable the experimental chat.agentHost.agentDebugLog.enabled setting before the activity that you want to inspect.
- Reproduce the issue and note the affected session. Capture is not retroactive.
Debug views and exported logs can contain prompts, source code, file paths, tool inputs and outputs, and other sensitive data. Review this content before sharing it, and never include credentials or secrets.
Investigate common scenarios
The AI ignores workspace files
If the response is generic or does not use the expected code:
- Open the Chat Debug view and inspect the Context section for the affected request.
- If a file is absent, confirm that you opened the correct workspace and that workspace indexing is available.
- Add the relevant file or code as explicit chat context, and then repeat the request.
- Reopen the Chat Debug view and verify that the expected context is present.
An MCP tool is not being invoked
If the model does not call an expected tool:
- Run MCP: List Servers from the Command Palette and verify that the server is running.
- Open the Chat Debug view and check whether the tool appears in the available tool definitions.
- If the tool is absent, troubleshoot the MCP server.
- If the tool is available, check the Agent Debug Logs for tool calls and errors.
- State the tool name and the action it should perform in your prompt, and then repeat the request.
The AI response is incomplete
If a response stops early or omits part of the task:
- Check the Agent Debug Logs for model request errors and token usage.
- Check the Response and Tool responses sections in the Chat Debug view to determine whether the model response or a tool result is incomplete.
- If the conversation contains unrelated or outdated context, use
/compactor start a new session and repeat the request. - If the logs show an error, include that error when you report the issue.
Instructions or a prompt file are not applied
Custom instructions and prompt files enter a request in different ways:
- Open the chat customization diagnostics view to check whether an instructions file was discovered and whether it has errors.
- For a
*.instructions.mdfile, verify that itsapplyTopattern matches the file you are working on. - For a prompt file, verify that you invoked it manually. Agents that run on the Agent Host do not use prompt files. For details, see Use prompt files.
- Check Discovery events in the Agent Debug Logs to see whether a customization was loaded, skipped, or rejected.
- In the Chat Debug view, inspect the System prompt for custom instructions and the User prompt for an invoked prompt file.
- Correct the discovery or applicability issue, repeat the request, and verify the corresponding prompt content again.
Agent Debug Logs panel
The Agent Debug Logs panel shows a chronological record and aggregate metrics for chat sessions. It also provides a flow chart for agent orchestration and access to the Cache Explorer.
Open the panel in either of these ways:
- Select the ellipsis (...) menu in the Chat view, and then select Show Agent Debug Logs.
- Run Developer: Open Agent Debug Logs from the Command Palette.
The panel includes current and historical sessions. Persisted logs are stored locally.
Logs view
The Logs view lists session events with their timestamp, type, and summary. Expand an event to inspect details such as the system prompt for a model request or the input and output for a tool call.
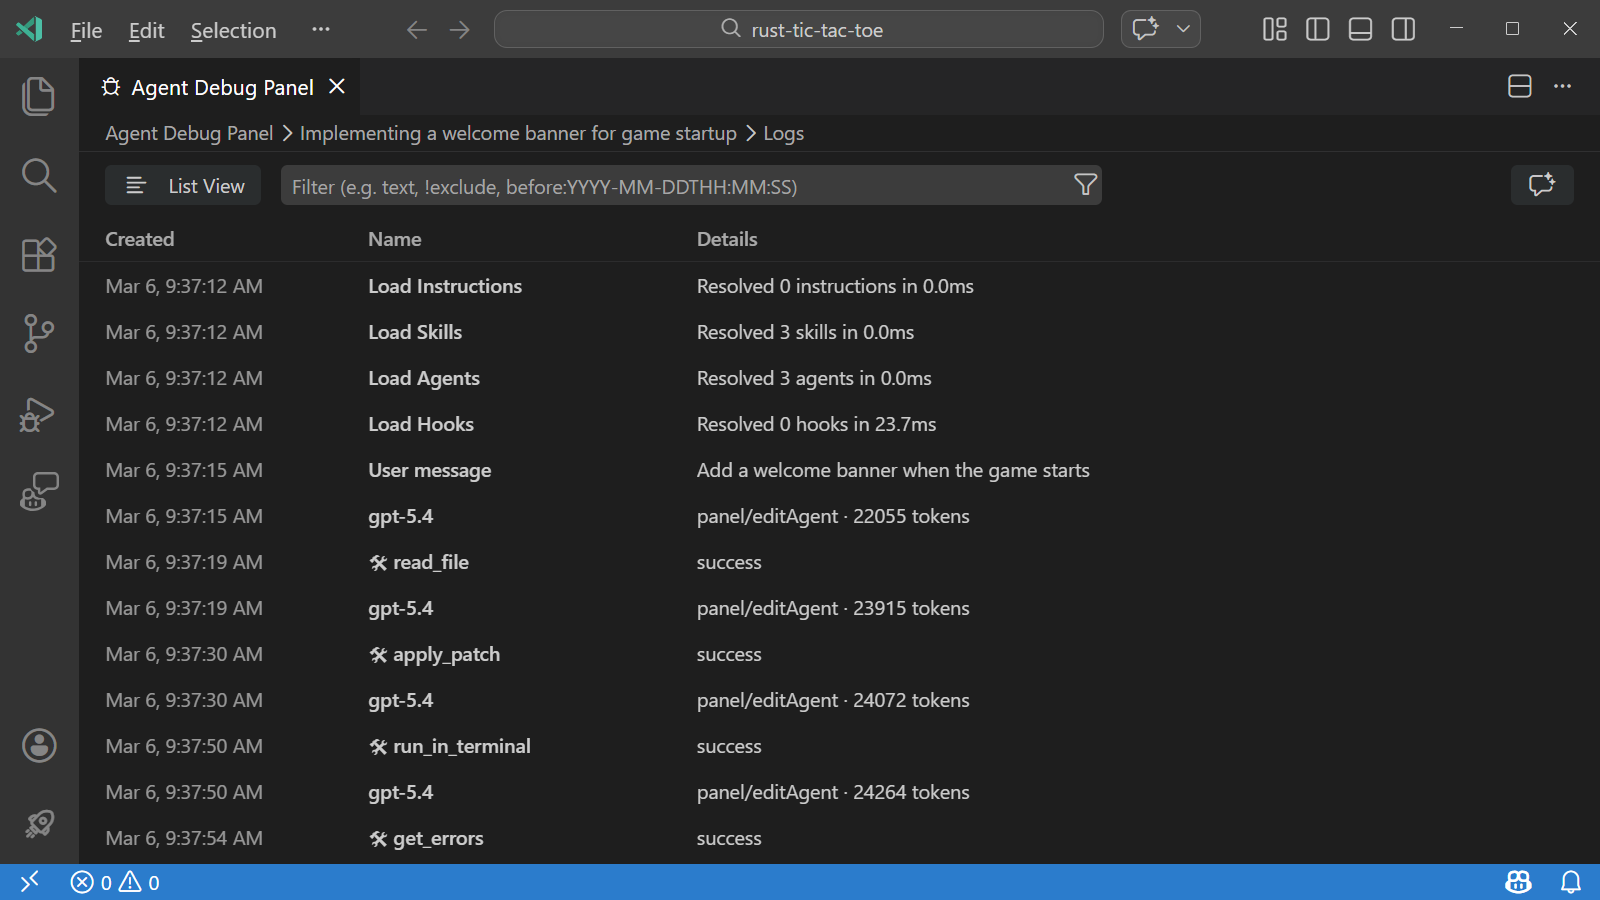
Switch between a flat list and a tree grouped by subagent. Use the filters to focus on events such as model requests, tool calls, discovery, or errors.
Summary view
The Summary view reports aggregate information such as tool calls, token usage, errors, and total duration. Use these metrics to identify which part of a session needs deeper investigation.
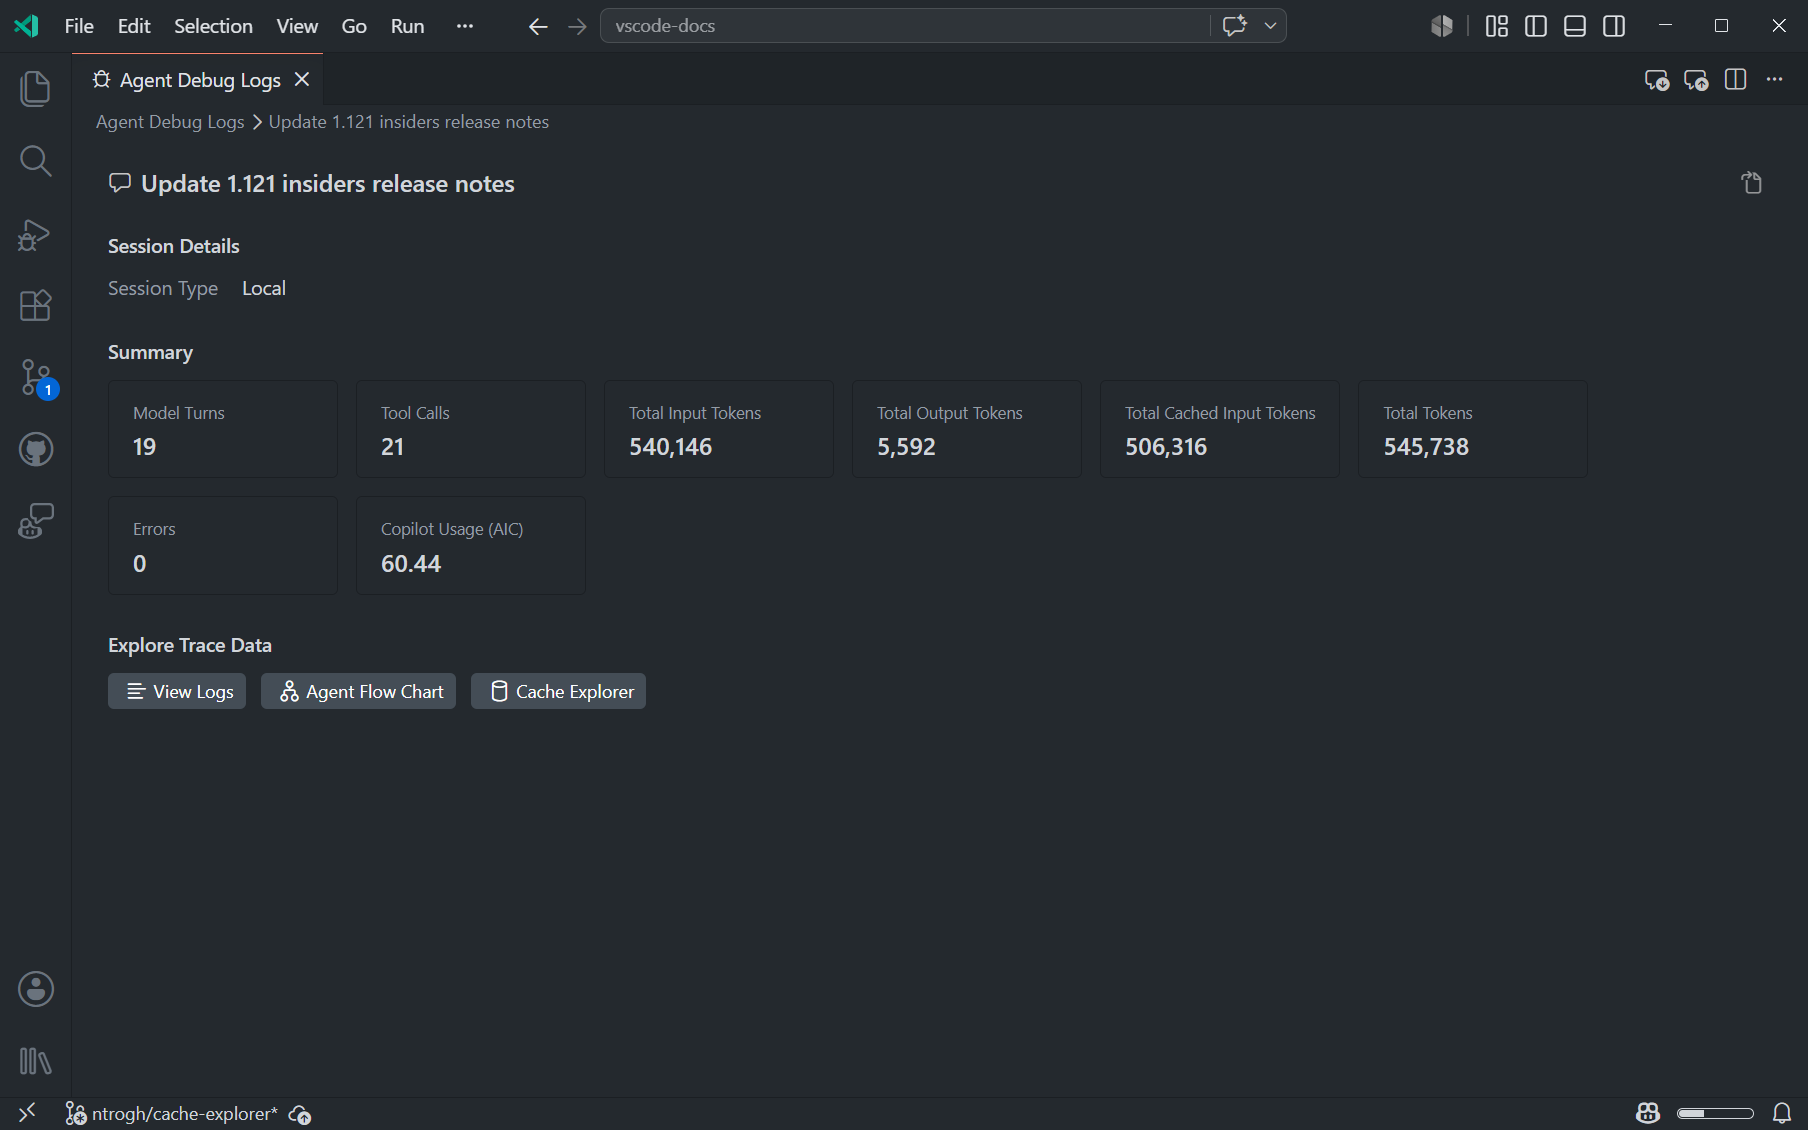
To open the Summary view:
- Open the Agent Debug Logs panel for the affected session.
- Select the session description in the breadcrumb at the top of the panel.
From the Summary view, select View Logs, Agent Flow Chart, or Cache Explorer to open the corresponding view.
Agent flow chart view
The Agent flow chart view visualizes the sequence of interactions between agents and subagents. Use it to identify which agent delegated an action and where a workflow stopped.
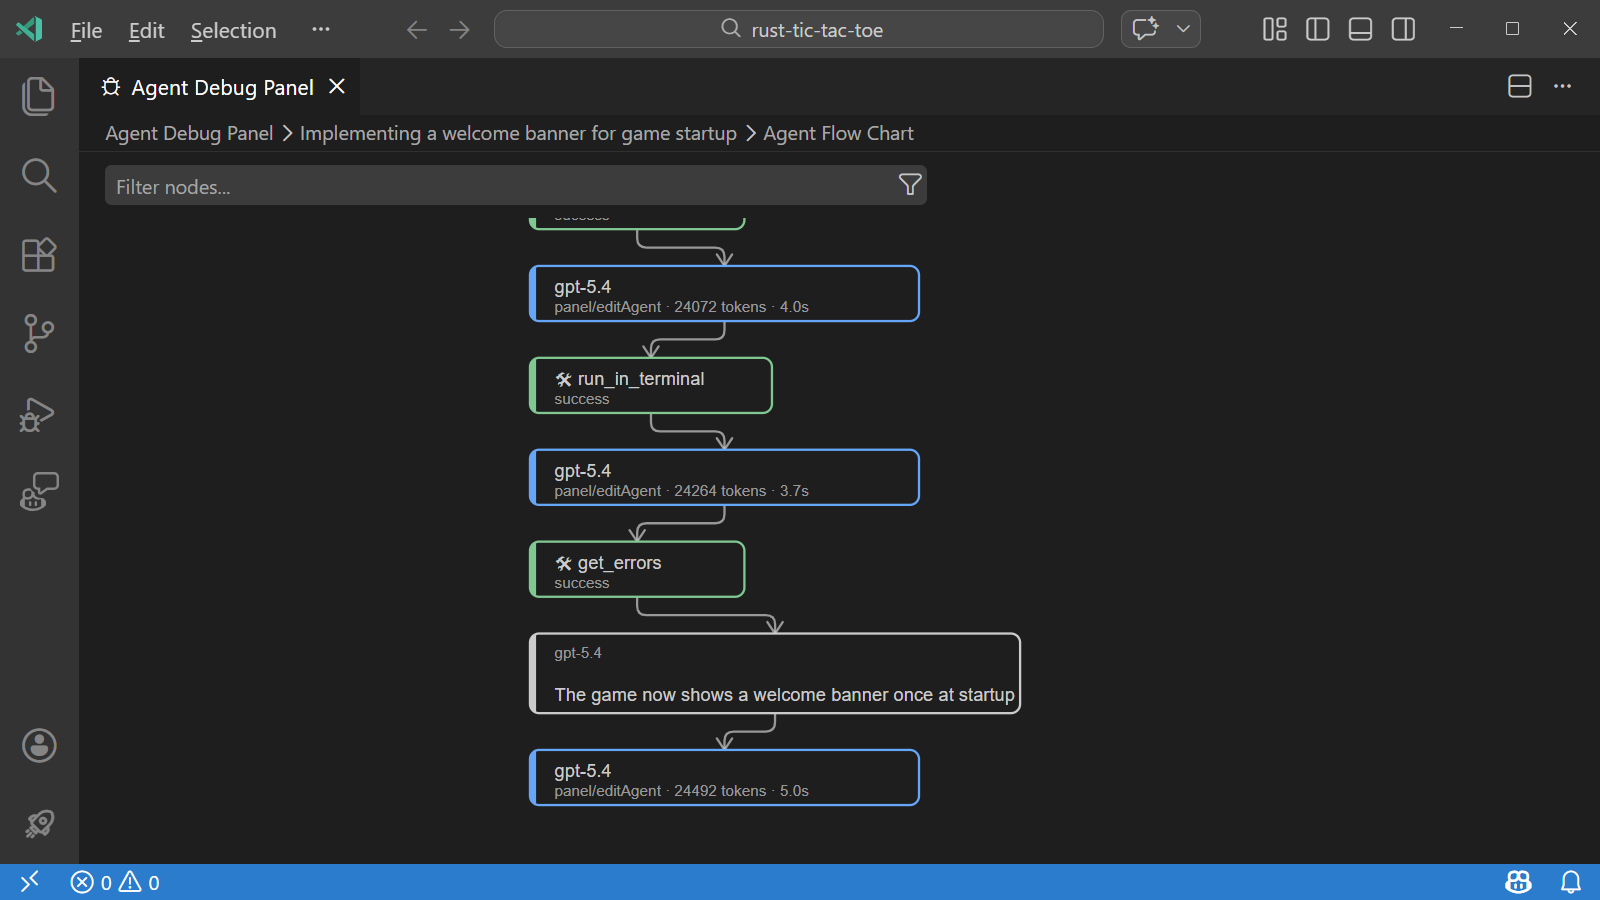
To open the flow chart:
- Open the Summary view for the affected session.
- Select Agent Flow Chart.
- Pan or zoom the chart, and select a node to inspect that event.
Cache Explorer view
The Cache Explorer compares consecutive model requests and marks their first divergence. Use it only after the Summary view reports low cache reuse together with unexpected duration or input token usage.
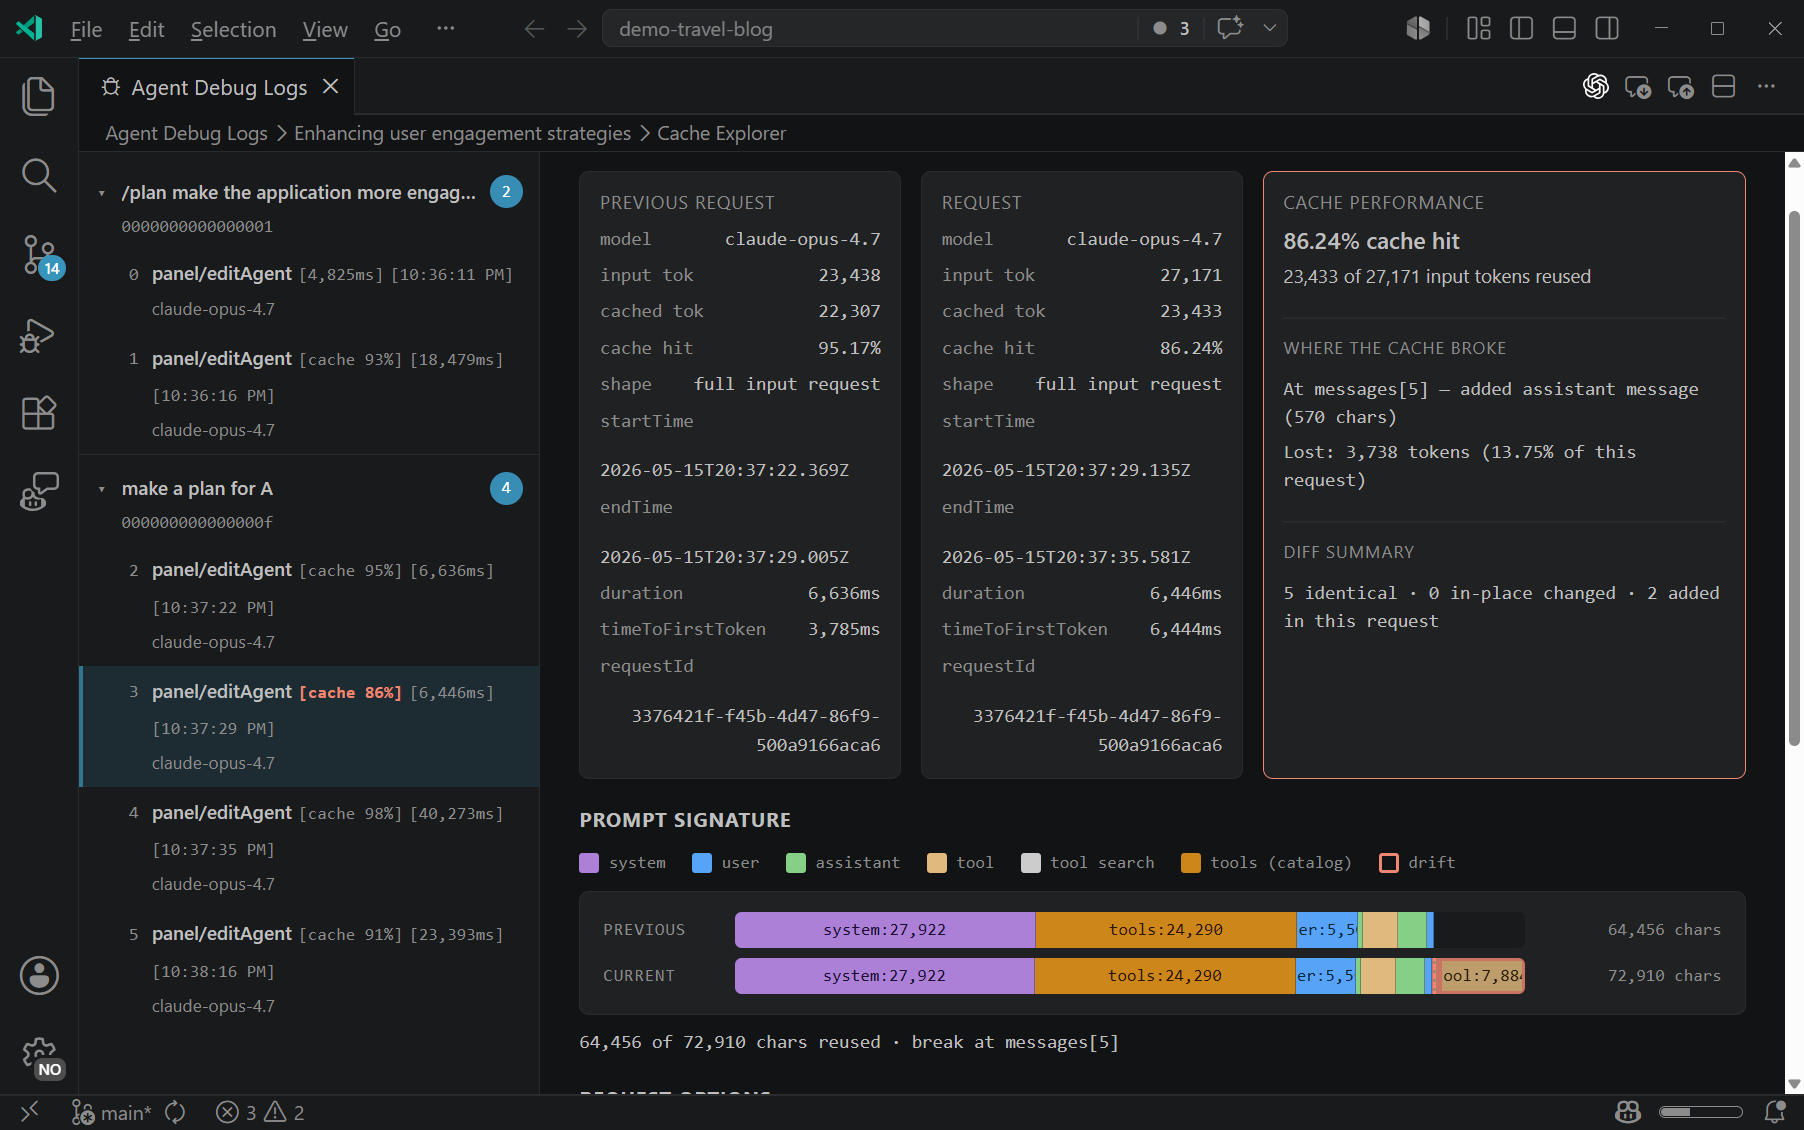
For interpretation and verification steps, see Diagnose prompt caching with the Cache Explorer.
Analyze debug events with chat
Attach a snapshot of the current session events to chat when you want the AI to answer a focused question about token usage, loaded customizations, tool calls, errors, or duration.
- Open the Logs view for the affected session.
- Select the sparkle icon in the upper-right corner of the Agent Debug Logs panel.
- Ask a focused question about the attached events.
Alternatively, enter /troubleshoot followed by a question. For example:
/troubleshoot Which customizations were loaded, and did any fail?
For a session in the Agents window, enter /troubleshoot #session, select the local or remote session, and then add your question.
Export and import sessions
Export a session to an OpenTelemetry JSON file in OTLP format when you need to retain the evidence or analyze it with another supported tool.
To export a session:
- Open the Agent Debug Logs panel and select the session.
- Select the Export icon in the upper-right toolbar.
- Choose a location for the JSON file.
- Review the exported content before sharing it.
To inspect a previously exported session:
- Select the Import icon in the upper-right toolbar.
- Select an exported Agent Debug Log JSON file.
- Use the Summary and Logs views to inspect the imported session.
Chat Debug view
The Chat Debug view shows the request and response details for each model interaction. Use it to verify which instructions, context, messages, and tool definitions reached the model.
Open the Chat Debug view
Open the view in either of these ways:
- Select the overflow menu in the Chat view, and then select Show Chat Debug View.
- Run Developer: Show Chat Debug View from the Command Palette.
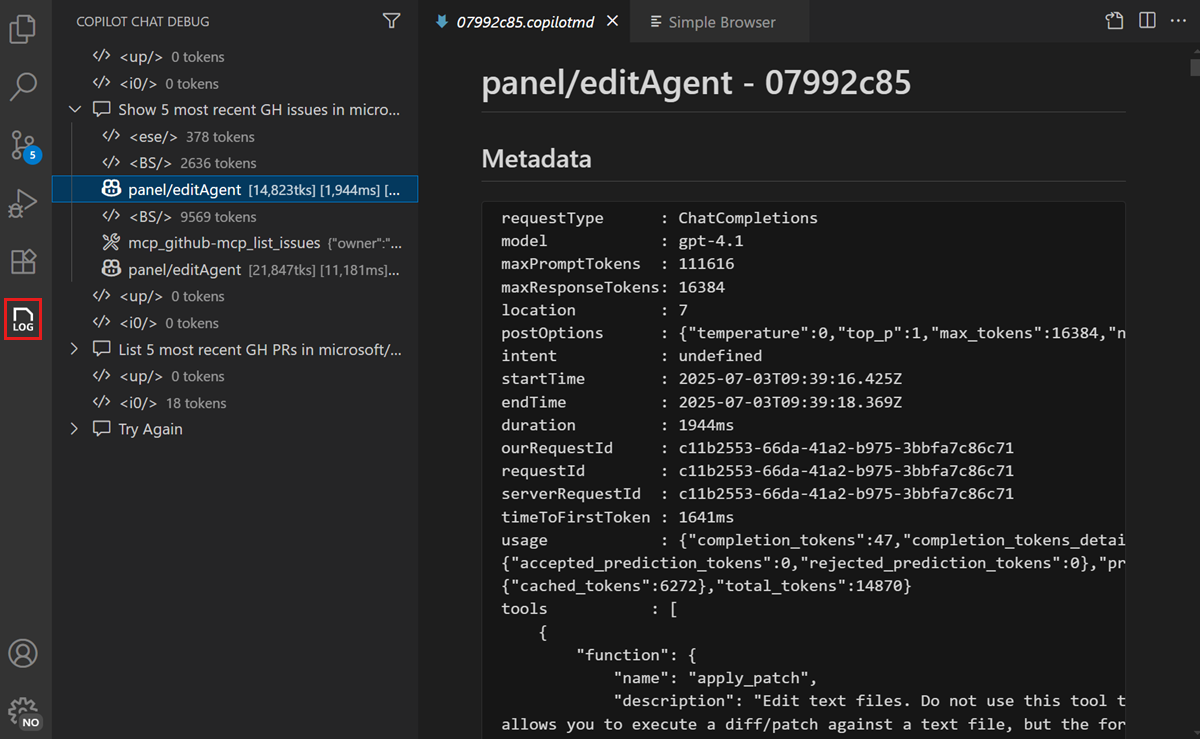
Read the debug output
Each interaction contains expandable sections:
| Section | What it shows | What to check |
|---|---|---|
| System prompt | Instructions that define the model's behavior, capabilities, and constraints. | Verify that expected custom instructions and agent definitions appear. |
| User prompt | The prompt sent to the model. | Confirm that prompt text and resolved references are present. |
| Context | Files, symbols, and other attached context. | Check whether the task's required context is present and relevant. |
| Response | The response returned by the model. | Determine whether the model returned complete content or an error. |
| Tool responses | Inputs and outputs for tools invoked during the request. | Verify that each tool received the expected input and returned a usable result. |
Verify the diagnosis
After you identify a likely cause:
- Change one relevant condition, such as a file pattern, server configuration, context attachment, or tool selection.
- Repeat a comparable request.
- Inspect the same event or request section.
- Confirm that both the diagnostic evidence and the user-visible result changed as expected.
If the evidence does not change, restore the previous configuration and investigate the next likely cause.