What Causes Floods in Texas?
4 minute readFlooding in Texas is driven by heavy rain, hurricanes, rivers, and rapid urban growth, making it one of the most flood-prone states in the nation.
Learn how to read Texas flood maps, spot emerging risks, and prepare for what comes next.
5 minute read • Last update August 2025
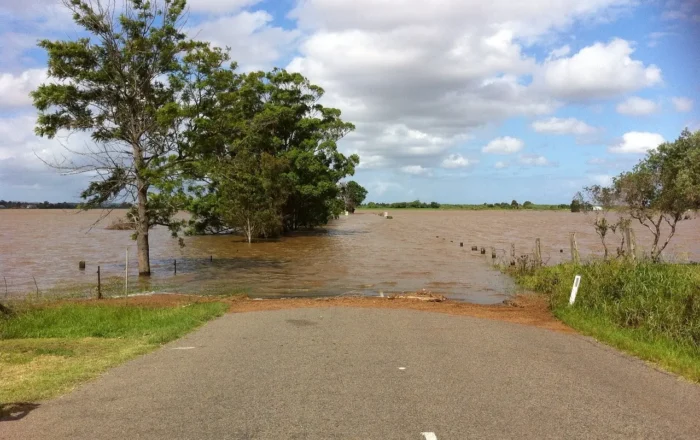
Texas is no stranger to water-related disasters. From flash floods sweeping through the Hill Country to hurricanes slamming the coast, flooding is a persistent and often unpredictable challenge across the state.
With 2025 bringing another wave of severe flood events, more Texans are turning to flood maps to understand their local risk. Here’s how to make sense of what you’re seeing, and why it matters.
Flooding is baked into Texas geography. The state’s vast landscape includes low-lying coastal plains, urbanized river basins, and rapidly changing elevation in regions like the Hill Country. These variations, combined with erratic rainfall and dense development, create the ideal conditions for multiple flood types.
Texas is also home to major rivers like the Brazos, Trinity, and Guadalupe—all of which drain storm runoff from wide swaths of land. As cities expand and cover more ground with pavement, natural absorption drops and runoff spikes. This not only increases flood risk but shifts flood zones in ways that older maps may not fully capture.
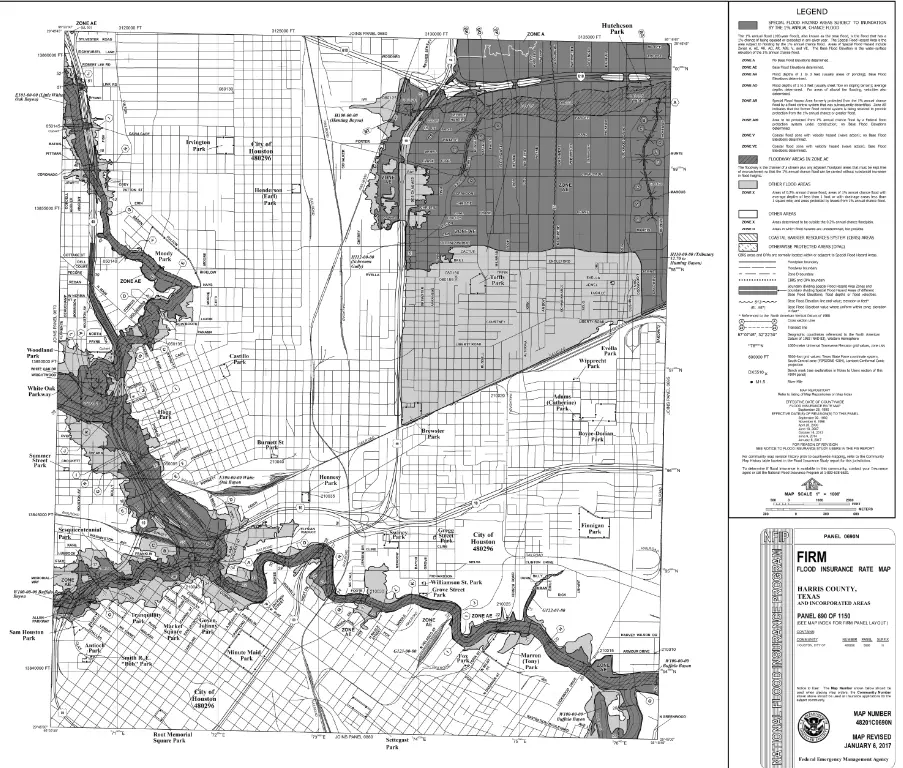
Flood maps aren’t just for experts. They provide critical real-time and historical data that residents, developers, and emergency planners all rely on. For homeowners, flood maps help identify whether a property lies in a high-risk zone, which can directly influence insurance requirements, home purchase decisions, and evacuation planning. For developers and city officials, these maps inform zoning laws, drainage system design, and long-term infrastructure investments. FEMA provides a public source of flood hazard information produced to support the National Flood Insurance Program. The example below is their map of flood risk for Houston, TX.
Most importantly, flood maps are foundational to preparing for a flood. Understanding the type and severity of flood risk in a specific location allows individuals to take proactive measures such as purchasing flood insurance, installing barriers or sump pumps, or creating emergency plans. It also helps evaluate flood risk when buying a home in Texas.
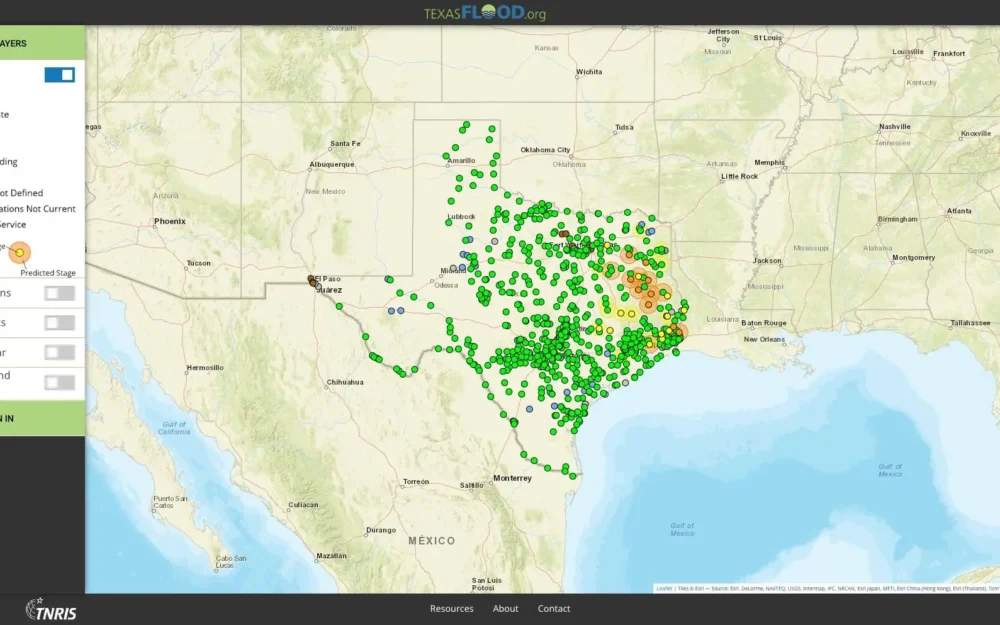
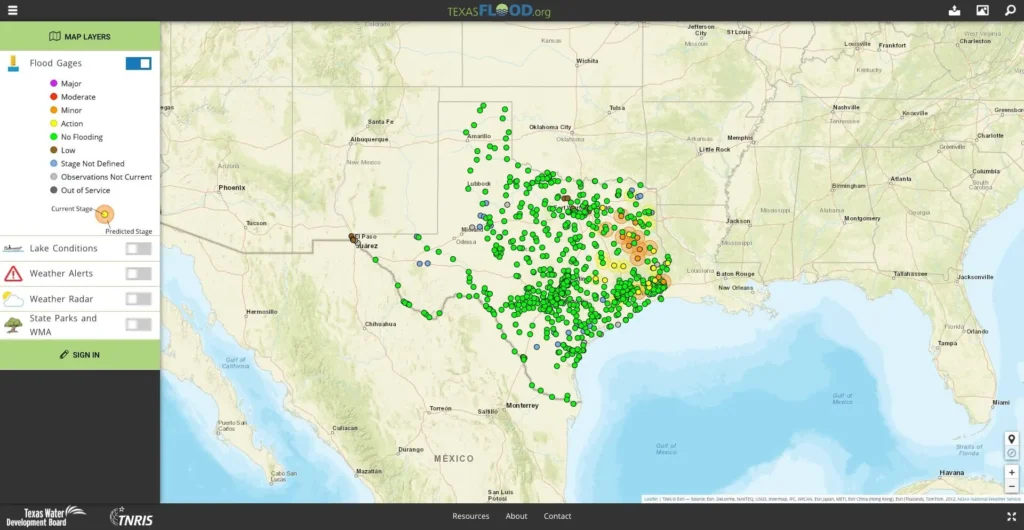
During severe weather events, real-time flood mapping can guide evacuation routes and highlight areas to avoid. In short, these tools turn complex hydrological data into actionable insights, helping Texans make informed decisions before, during, and after a flood. Below is an example of a real-time flood map that displays current flood gages from texasflood.org.
This year, flooding has once again dominated headlines across Texas. Several regions saw above-average precipitation and flash flood events that overwhelmed drainage systems.
Texas received widespread rainfall over 10–20 inches, and soils were already saturated, leading to extreme runoff as the ground could no longer absorb more water. Multiple locations reported totals exceeding 12–15 inches in a few hours, with peak totals reaching 20.33 inches in parts of the Hill Country during the July 4–5 flooding event.
USGS real-time water data for Texas showed streamflow conditions in many basins well above the 90th percentile for this time of year, meaning current river and creek discharge measurements exceeded 90 % of historical values, marking them as significantly above normal
When compared to previous major flood years, 2025 is shaping up as a high-impact year—though not unprecedented.
While 2025 may not match Harvey in terms of total rainfall, the geographic spread of impact and frequency of events has been significant. FEMA has already issued multiple disaster declarations, with insurance claims topping an estimated $1.2 billion statewide. In several counties, this year’s events have redrawn local understandings of flood risk.
Flooding has always been part of Texas’s natural hydrologic cycle, particularly during the spring and fall when the state is most vulnerable to heavy rainfall and tropical systems. These seasonal patterns are well documented, and occasional localized flooding has long been considered normal. However, recent data and on-the-ground impacts suggest that what was once considered normal may be evolving.
One of the clearest shifts is the intensity of rainfall events. Texans are increasingly experiencing high-volume storms that drop inches of rain in a matter of hours. These short-duration, high-intensity events produce significantly more runoff than slower, steady rains. This overwhelms creeks, bayous, and stormwater infrastructure. The result is more frequent flash flooding, especially in urban and semi-urban areas.
Compounding this trend is the rapid pace of urban development across much of Texas. As more land is covered with impervious surfaces like pavement, rooftops, and parking lots, the ground’s ability to absorb rainwater diminishes. Natural drainage patterns are disrupted, and more water is diverted into already strained man-made systems. This increases the severity of floods and can shift risk to areas previously considered safe.
In response to these changing conditions, agencies like FEMA and the Texas Water Development Board are updating floodplain maps to incorporate modern rainfall models and hydrologic data. Areas once classified as low-risk are now being reassessed, and many are being re-designated as part of FEMA’s Special Flood Hazard Areas. These changes carry serious implications for insurance, property development, and emergency planning. It is more important than ever for Texans to understand how their flood risk is changing over time.
For real-time updates and flood preparedness, these tools are the best places to start:
Flood maps are more than just risk assessments; they help reveal long-term patterns in weather, land use, and emergency response. For homeowners and renters alike, knowing your flood risk informs decisions about property investment, insurance coverage, and safety planning.
Bookmark the resources listed above and make a habit of checking them during storm season. Understanding what’s normal and what’s not on the Texas flooding map could be the difference between reacting and being prepared.
Want to dive deeper into Texas weather, preparedness tips, and energy insights? Explore more articles in BKV Energy’s blog and stay informed year-round.